Fair question. Here are all the greenhouse gases with historical concentrations and projected out until 2500. https://gmd.copernicus.org/articles/13/3571/2020/
Climate Change

How Hot is Hell? I Mean Earth?
Do you want to get frustrated by climate scientists? Just ask them what the current level of global surface warming is above the IPCC 1850-1900 pre-industrial baseline. In response, you’ll hear numbers ranging from 1.0°C up to about 1.3°C, depending on your source. The lack of rigor and consistency in reporting this all-important number is crazy-making. But this singular value is core to the Paris limit. Being able to say when we’ve broken that limit is absolutely critical to understanding the near-term future of tipping points, feedback loops and collapse. It’s also important for the media and climate scientists to be on the same page in their reporting. Everyone’s credibility is on the line here.
In this post, in an attempt to regain my sanity, I will do my own computation of the current level of global surface warming above the 1850-1900 baseline.
Of course, it is common knowledge that 2023 was the hottest year in recorded history and possibly the hottest year in over 100,000 years. If the long-term average was one year alone, we could comfortably say the Paris limit has been broken. But that’s not climate, that’s one very hot year due to a variety of transient impacts whose future contribution is uncertain. We have to be very careful to not jump to collapse scenarios when it comes to climate vs. weather. I stand firmly and confusedly (is that a word?) on the climate side. We must consider the long-term average in order to determine when the Paris limit is broken.
And so, the key question is, where do we stand with respect to the 1850-1900 IPCC pre-industrial baseline today? Let’s do a quick survey.
Bard AI:
The planet has warmed by approximately 1.1 degrees Celsius (1.9 degrees Fahrenheit) since the 1850-1900 baseline. This may seem like a small number, but it’s actually a significant change and represents a large amount of accumulated heat. The rate of warming has been accelerating in recent decades. Since 1975, the planet has warmed at a rate of roughly 0.15 to 0.20 degrees Celsius per decade.
ChatGPT:
As of my last knowledge update in January 2022, the Earth’s global average temperature had increased by approximately 1.2 degrees Celsius (2.2 degrees Fahrenheit) above pre-industrial levels, which is often taken as the period from 1850-1900.
Here’s what Climate.gov says, in this article from January, 2024.
“The roughly 2-degree Fahrenheit (1 degrees Celsius) increase in global average surface temperature that has occurred since the pre-industrial era (1850-1900 in NOAA’s record) might seem small, but it means a significant increase in accumulated heat.”
There’s this article from Bloomberg in 2020, headlined, “Global Temperatures Already 1.2°C Above Pre-Industrial Levels.”
Next up, this Climate Analytics article from January, 2023 puts the global average temperature broadly at 1.1°C to 1.3°C above pre-industrial temperatures.
But what finally pushed me over the edge was this recent video by Dr. Gilbz where at 0:14 she said, “given that temperatures have already risen by 1.26 degrees…” I mean, what the f&%k? Where did that super-precise number come from?
Fortunately for me, one of the readers of this blog (thanks Mango!) answered my question soon after I posted this blog article. What you’re reading here is an add-on edit. Here is the relevant quote Mango shared (see this Met Office article):
Over the last few days I had a Twitter discussion with a climate scientist and asked for a more rigorous definition of the long-term average, as used to determine the Paris limit. This climate scientist agreed with Prof. Richard Betts in the quote above that the temperature should be based on a 20-year average, but not the trailing 20 years, as many (myself included) believed. Rather, it should be the average of the previous 10 years as actually measured, together with the forecast for the next 10 years based on models, with the current year in the middle of that span. Average all those temperatures together and that’s where we are today.
And that’s the first time I have heard this definition. I find it to be very reasonable, and one that I can work with. So I decided to do this computation using this definition together with data from Copernicus ERA5 (available here). This data gives accurate daily global surface temperatures for the period 1940-2024. Another file available from Copernicus gives their 1850-1900 pre-industrial baseline, day-by-day. The data in these two files allowed me to compute the day-to-day anomaly with respect to the pre-industrial baseline for every single day from 1940 to the present.
The key step was to focus on “decadal average gains.” Just like mentioned in the Bard AI quote above, I wanted to know the rough rate at which the planet is warming per decade. For this, I considered each day from January 1, 1950 to December 31, 2023, and compared that day’s global mean surface temperature with the same day from 10 years earlier. Focusing on a single day gives a lot of variability, so I included a “least squares” linear trendline to get a sense for the average gain per decade. I then extended the trendline 10 years into the future, to get the decadal gain through the end of 2033. Here’s what I got:
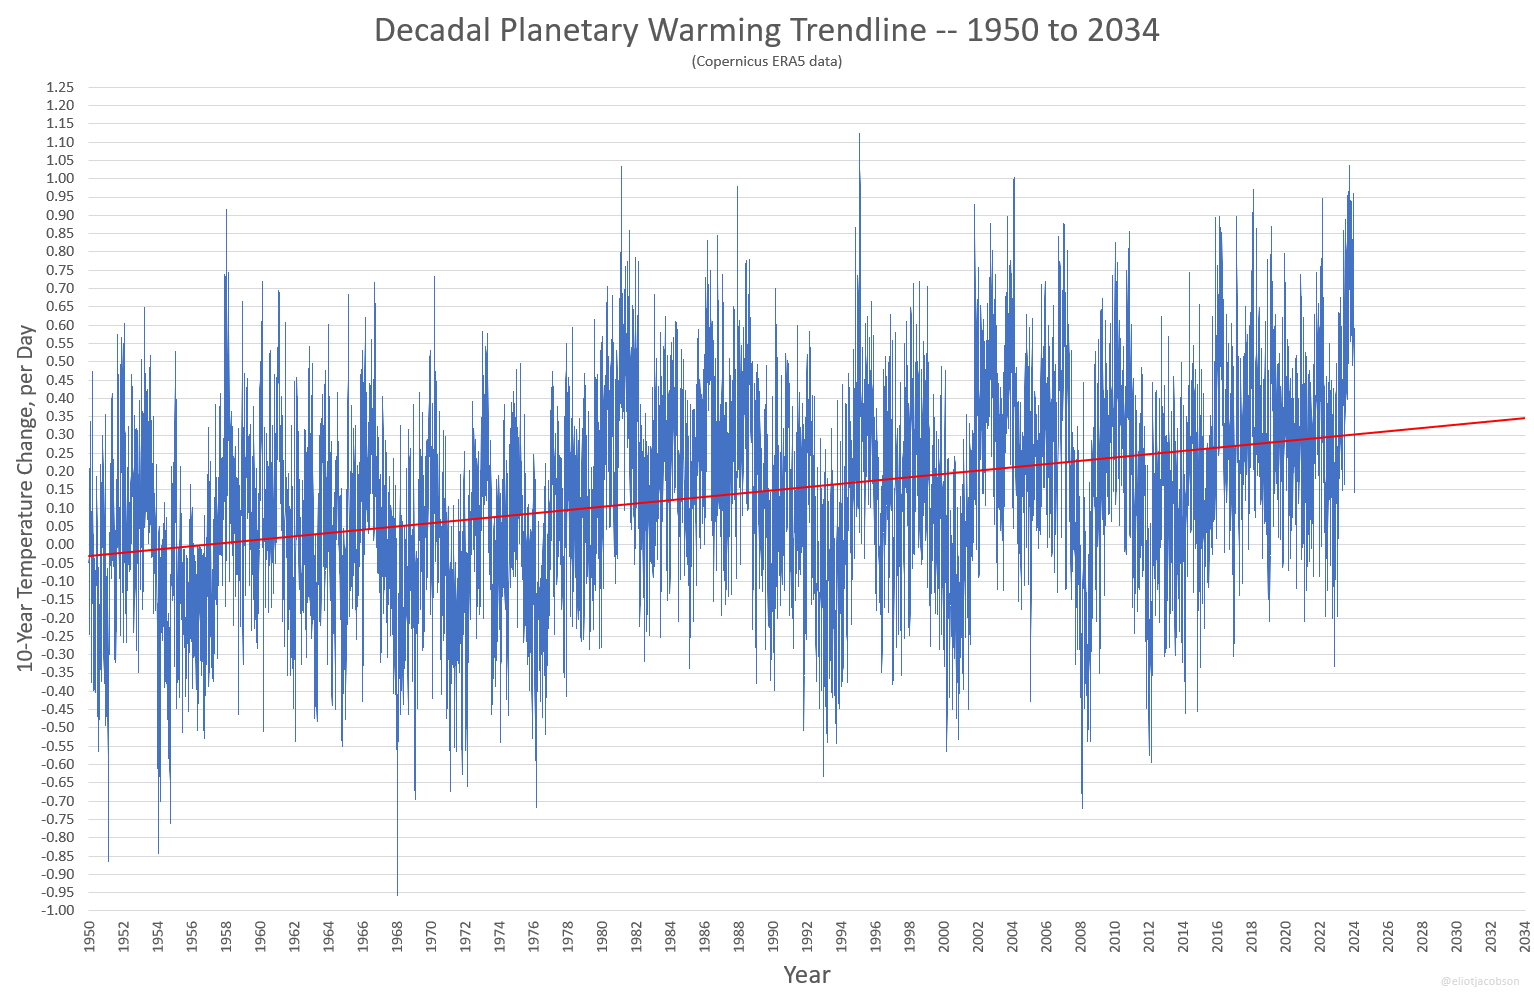
If you examine this graph closely, you will see that as of 2024 we are roughly at 0.30°C gain per decade, but by 2034 this rate of change will rise to 0.35°C per decade. In other words, the rate of decadal warming is increasing. More precisely, each year the decadal warming appears to rise by roughly 0.005°C. This is the very definition of accelerated warming, which is what Hansen et. al. have been claiming for a long time. For example see this article in The Guardian from November, 2023.
So, where did I go from here? Well, I needed to model a decade into the future. I used the accelerating decadal warming from the trendline in the preceding graph to make this forecast. In other words, I assumed:
- The year 2024 will be 0.300°C warmer than 2014.
- The year 2025 will be 0.305°C warmer than 2015.
- The year 2026 will be 0.310°C warmer than 2016.
- … continuing …
- The Year 2033 will be 0.345°C warmer than 2023.
First, I took the daily temperatures from each day in 2014 and added 0.300°C to get the modeled daily temperatures in 2024. I then added 0.305°C to the daily temperatures in 2015 to get the modeled daily temperatures for 2025. And so on, until I added 0.345°C to the daily temperatures in 2023 to get the modeled daily temperatures for the year 2033. At the end of the process, I had the actual daily temperatures from January 1, 2014 to December 31, 2023 and I had the modeled daily temperatures from January 1, 2024 to December 31, 2033. I then used the IPCC baseline to compute the daily anomaly for each day in this 20 year period. That’s 20 years centered on January 1, 2024 consisting of 10 years past and 10 years into the future. Finally, I averaged it all together to get the current level of warming.
And the value I got was 1.38°C.
So, that’s my value. The current warming with respect to the pre-industrial baseline as of the start of 2024 is 1.38°C. And this value is significantly higher than any value stated publicly by any climate scientist or media source. What the f&%k? Or, to quote Sartre, “Hell is other people.”
As an aside, I think there are two reasons the scientists at the Met Office came up with 1.26°C. The first is that their values tend to be on the low end compared to other international datasets. The second is that, apparently, they used 0.2°C for their decadal average. I don’t know their actual methodology, but this speculation is a possibility. And, by the way, if I use the Met Office’s outdated value of 0.2°C per decade with the ERA5 data, I get a current anomaly of 1.32°C above the pre-industrial average. I am scratching my head.
Okay, but what about the future? When will we break the Paris limit? According to most media sources (and even previous predictions I’ve made), the early 2030’s is when the big event will happen. For example, this recent article in the New York Times states,
…global average temperatures are estimated to rise 1.5 degrees Celsius (2.7 degrees Fahrenheit) above preindustrial levels sometime around “the first half of the 2030s,” as humans continue to burn coal, oil and natural gas.
Yeah. That’s wrong. Because the current rate of warming is 0.30°C per decade, it will take about 4 years for the temperature to rise the 0.12°C from 1.38°C to 1.50°C. Four years. That puts us breaking the Paris limit for good in the year 2028.
Of course, this analysis assumes that no catastrophic climate event happens in the next few years. A sulfur spewing volcanic mega eruption or a blue ocean event in the Arctic will change everything.
In summary:
- At the start of 2024, we are 1.38°C above the 1850-1900 pre-industrial IPCC baseline
- The current decadal average gain is 0.30°C, rising to 0.35°C per decade by 2034.
- Global temperatures are accelerating.
- We will break the Paris limit by the end of 2028.
Take it or not, I am satisfied with this result. It has the look, feel and smell of being right. And isn’t that what climate science is really all about anyway?
Thanks, Prof.
I find myself in twitter jail and unable to comment on your recent posts, but I appreciate this detailed explanation of your methodology.
Looks, smells, and feels right to me, too.
I hope Doc Gilbz can be bothered to explain where her number came from 🤷🏻♂️
It came from a met office scientist’s study –
https://www.metoffice.gov.uk/about-us/press-office/news/weather-and-climate/2024/2023-the-warmest-year-on-record-globally#
“In a recent paper published in Nature, Met Office scientist Prof Richard Betts and coauthors proposed an indicator combining the last ten years of global temperature observations with an estimate of the projection or forecast for the next ten years. If adopted by the international community this could mean a universally agreed measure of global warming that could trigger immediate action to avoid further rises.
Using this suggested approach, the researchers found that the figure for the current global warming level, relevant to the Paris Agreement, is around 1.26 °C, with an uncertainty range of 1.13 °C to 1.43 °C.”
Ah this is very helpful, and also explains 1.26C. I am guessing they don’t have the same decadal warming that I do, and they tend to run on the low end anyway. I will be editing my post to reflect this new information. Thanks again!
Thanks for this. It all sounds reasonable but two things concern me.
Firstly, let’s say the climate “knows” it’s already at 1.5°C warmer than preindustrial. (Humans, of course, can’t confirm this without many years of data.) It means we should already be dealing with that situation. However, using the past 10 years of data, even with reasonable projections, could put us still well shy of 1.5°C and we’ll pretend we’re not there yet even though we are.
Secondly, what is the definition of preindustrial? I’ve seen a few estimates but it seems reasonable to assume that the 1750 climate was at least 0.05°C cooler than 1850. That would put us at, at least, 1.43°C warmer, given your calculations.
Some other comments:
Would taking the average temp of the previous 10 years, instead of the gain over the period, change anything? It seems to me that we could have some natural variation which could make the most recent day cooler (or less of an increase) than 10 years ago. This may not matter with so many days and comparisons, so it may not be an issue.
One of the papers referenced by the Met Office article estimates current human induced warming (very similar to the observed warming) is “over 0.2°C per decade” which doesn’t preclude its being 0.3°C per decade but the number in the paper is probably close to 0.2 than 0.3. However, that paper calculates warming up to the 10 year period ending 2022 as 1.15°C, so well behind this year. https://essd.copernicus.org/articles/15/2295/2023/
The Met Office has a dashboard with the new indicator in it but using two projections. For 2022, it shows warming of either 1.25°C or 1.31°C, depending on the projection used. https://climate.metoffice.cloud/current_warming.html.
Is it possible to subtract out the influence of ENSO and volcanos? Or has this already been done for these calculations?
Thanks for your excellent comment.
ENSO shouldn’t be subtracted, as it is mixed with La Nina, and the long-term influence of both on temperatures belongs there. As for volcanos, the recent H/T was analyzed quite extensively for the impact of the water vapor and it was found to be negligible. But if a Mt. Pinatubo type event happened, that would certainly impact the analysis.
I sent in a complaint to the BBC, as their climate reporting (example: https://youtu.be/cEpA0NU0NL8) was basically numberwang (TV show sketch: https://youtu.be/0obMRztklqU ). Mixing 30 year averages, 1850-1900 baselines, datasets. The report was factually accurate but meaningless to anyone who didn’t already understand the details. I keep seeing people reporting on 1.5C paris, and then showing a 30-year average graph where temp anomaly is obviously lower, having a more recent baseline.
Hi Eliot and Co., great topic. I recently ran across “BERKELY EARTH” and their Jan. 11, 2024 post: “Global Temperature Report for 2023”, and I’m impressed with it, especially their estimate of “1.54 +- 0.06 degC (2.77 +- 0.11 degF)”. Their extensive and wonderfully illustrated 65 ?pg. paper includes a massive amount of data including a graph of “Global Average Temperature 1850-20223”, which shows a 1.04 degC increase in the past 40 yrs.on a “hockey stick” curve. 2022 was 1.25 degC warmer, so the jump to 1.54 is 0.29 degC, or a 23% jump in just one year and a 50% jump since 2012, 1.00 degC. Land increase was 2.10 and ocean reached 1.10 degC, a 17% increase in 4 yrs. I encourage all to look-up this paper at “BERKELEY EARTH”, posted by Robert Rohde. Peace, out, Gregg
Hi Eliot!
I expect that you are getting a hands-on “feel” for the consequences of global heating and ocean heating producing 1 trillion tons of water vapor per day. What goes up must come down. Hope you’re high and dry in Santa Barbara. I looked at fossil fuel production in neighboring West Virginia yesterday and discovered that the heat equivalent of one Hiroshima yield bomb is produced every 4 days there, but 5,497 trillion BTUs are produced annually. Quite an accomplishment, right? No.
IPCC 1.5C Special Report – page 4. Footnote: 5: “Present level of global warming is defined as the average of a 30-year period centred on 2017 assuming the recent rate of warming continues.”
And the first “Drafting Author: Myles Allen (UK)” (listed on page 3)
… can be found discussing at length the minutiae of discussing the “current temperature”
https://www.youtube.com/watch?v=jaOsJv0lvq4
> (16:53) – Rolling 30 year average was the standard WMO definition
> Physics definition I didn’t understand
> (20:10) 30 year average, centred on present, using projections / trends
> (20:53) … formal definition
> Anecdote about volcano going off
> (24:30) … projected to get to 1.5 in 2040 with the 30-year-centred-on-2017 graph
> (27:00) interesting anecdote about global warming measurements affected by type of bucket used
> (29:00) A lot more discussion about definitions … including “pre-industrial”
> (33:00) Should 1883 Krakatoa eruption be included in the 1850-1900 period ?
Can’t find similarly clear definition in the AR6-WG1 report.
Thanks for this — excellent information.
I would agree with 30 years centered on 2024, it would likely give just about the same value as 20 years centered on 2024 (what I did), but for the caveat in the language “assuming the recent rate of warming continues.” This rate of warming used for a long time, 0.20C, is definitely not current nor continuing. The rate of warming itself must be accurate and forecast in to the future in as robust a way as possible. I am comfortable with 0.30C as the current decadal value, increasing 0.005C per year.
Thanks again!
Thank you for this piece. Though much is over my head. Wish I had someone like you as a math teacher as a child. Anyway, for me as a non scientist what I’m understanding is you’ve nailed the rate of heat acceleration to 0.30 degrees C per decade. Putting us beyond Paris in 2028. This is such a confusing topic for the likes of me and to be honest lately I’m reading a lot less papers, but I’m really glad you’re here keeping us all fully informed. Love all the comments on here too!
Global heating is surpassing even the most well thought out estimates, like Eliot’s, and the current mid-March Copernicus/Berkeley Earth data shows 4 days in Aug. 2023 and, again, in Feb. 2024 when Earth ave. air temp’s. reached 2 degC, long ago typical of the Arctic, where temp’s over 2.5 degC are known. Experts are now using the “A” word (acceleration) to describe the rapidly rising air temp’s., and land temps are even higher, with the US at 2 degC last yr. on ave. And none of this factors in the enormous amount of heat energy being sequestered in the 3.3 billion tons of global ice melting daily, or the 321 million cubic miles of oceans heating to 70 degF in the mid-latitudes, or the 1 trillion tons of water vapor evaporating into the skies, all of which are capturing and storing “latent” heat energy from the air, and, without which, we’d be 65 degF hotter today.
Young Eliot felt he was lucked.
So, about in the data, he mucked.
And hardened the tack
To Paris and back
And found that, in truth, we are f&%d.
Hi, thanks for the good and informative read.
I was wondering, there was recently a new study which seems to have found out that the 1850-1900 period was actually 0.24 °C colder, which would make current estimates 0.24 °C warmer.
This means that we have passed 1.5 °C right?
Article about the study; https://www.theguardian.com/news/article/2024/may/24/last-summers-temperature-rise-could-be-worse-than-we-thought
@ariadna, thanks for that link. following it to the original Nature article only yields an abstract (article is paywalled). my take is that Paris committees based their 1.5°C above pre-industrial on their best understanding of what pre-industrial was. if instead pre-industrial had been known to be 0.24°C lower at the time, then I suspect the Paris committee would have settled on a 1.75°C goal instead of 1.5°C. So technically, if we accept this new baseline, we’ve probably passed 1.5°C, but probably not passed the spirit of the Paris agreement. I think that makes sense, but I could be wrong.
My gut feel, or impression from news, is that the loops in play mean we are around 1.5 ( 1.4 is just .1 sifference).
I don’t know whether to collect my Soc Sec now or in 4 years
Thank you very much for this informative article. I’m not a mathematician or an expert but it seems very logical to center averages in the present rather than half the”window” into the past. I have a fat (and possible dumb) question: if you fit a line to the noisy curve, shouldn’t the “acceleration” be zero by definition? I’m other words: wouldn’t a line give you the same increase any decade no matter when?
Thanks!