The “Keeling Curve” for the Earth Energy Imbalance
The rate at which Earth is heating up due to the rise in greenhouse gasses is best described by what’s known as the Earth Energy Imbalance (EEI). This is the difference between the amount of incoming solar radiation that heats the planet and the outgoing radiation of all types that escapes back into space. As James Hansen and a group of scientists put it in a recent paper, “The absolute value of EEI represents the most fundamental metric defining the status of global climate change, and will be more useful than using global surface temperature.”
Unlike weather, which changes wildly from year to year, the EEI is a direct measurement of the rate of heating of the planet. Heat in minus heat out. Couldn’t be any simpler than that. If you want to take a deeper dive, here is a good article on the topic.
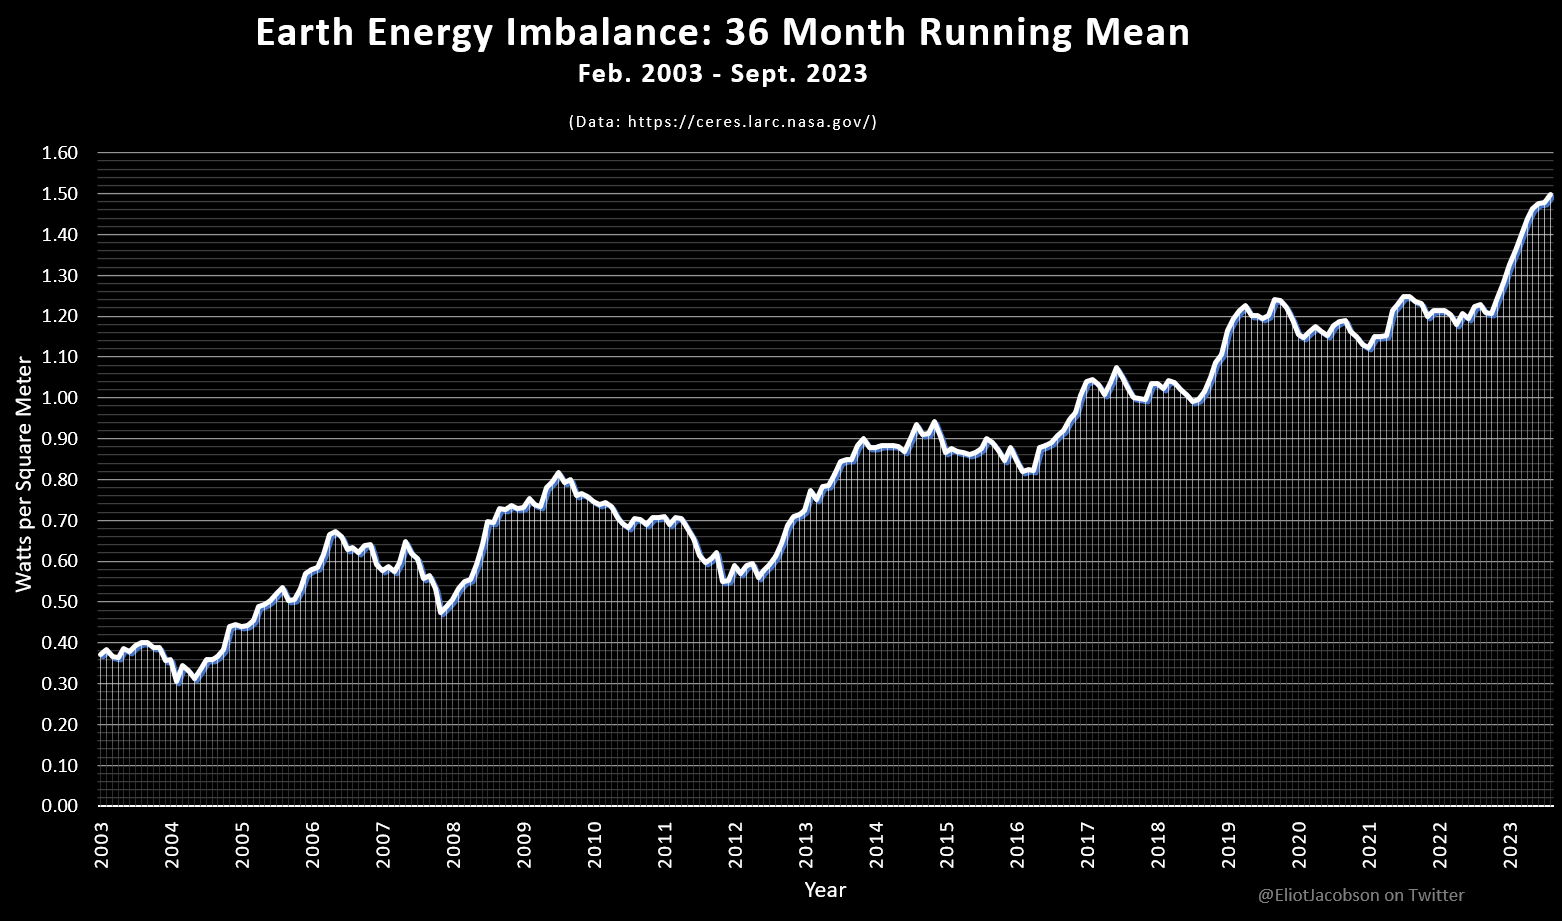
Unfortunately, data for the EEI does not date back very far. The best data I can find starts in March, 2000 and is current up to September, 2023. EEI data is available from CERES. The EEI is measured in units of Watts per square meter (W/m²). Because transient weather, especially clouds, can impact the EEI dramatically on a year-to-year basis, climate scientists prefer to work with a 36-month running mean (I’ve seen a 48-month running mean as well) for the EEI.
Here is a graph of the 36-month running mean for the EEI for all of the available data, from February 2003 through September, 2023. It shows that over the last 36 months, the rate of warming has been about 1.50 W/m². Moreover, this graph shows that there has been about a four-fold increase in the rate of heating over the course of the last 20 years.
There is another way of viewing this warming that gives a more intuitive perspective. In this article, I show how to convert from W/m² to another unit, namely, “Hiroshima bombs per Second” or HpS. The formula for the conversion is:
HpS = 8.12 × EEI
Using this formula and the latest value for the EEI, we find that the planet has been warming at an average rate of 8.12 x 1.50 = 12.2 HpS over the last 36 months. Multiplying everything out, this gives a total 36-month planetary heat gain equivalent to the total heat from 1.15 billion Hiroshima bombs.
This result calls for a new unit of planetary heating — the “Giga Hiroshima Bombs” unit, or GHB, representing the heating of Earth by one billion Hiroshima bombs. (Thanks to Twitter user @DSCHthan for suggesting this unit). With this unit in mind, we find that Earth has heated by 1.15 GHB since September, 2020. A deeper computation shows a total heating of 4.63 GHB since EEI data began being collected in March, 2000.
We need to take a momentary diversion to discuss carbon dioxide, CO₂. In case you don’t know what the Keeling curve is, it is the curve that shows the monthly total amount of CO₂ as sampled at the Mauna Loa observatory in Hawaii, in units of parts per million (ppm), since data began being collected there in 1958.
Here is the latest Keeling curve, through October, 2023,with the black line showing the 12-month running mean: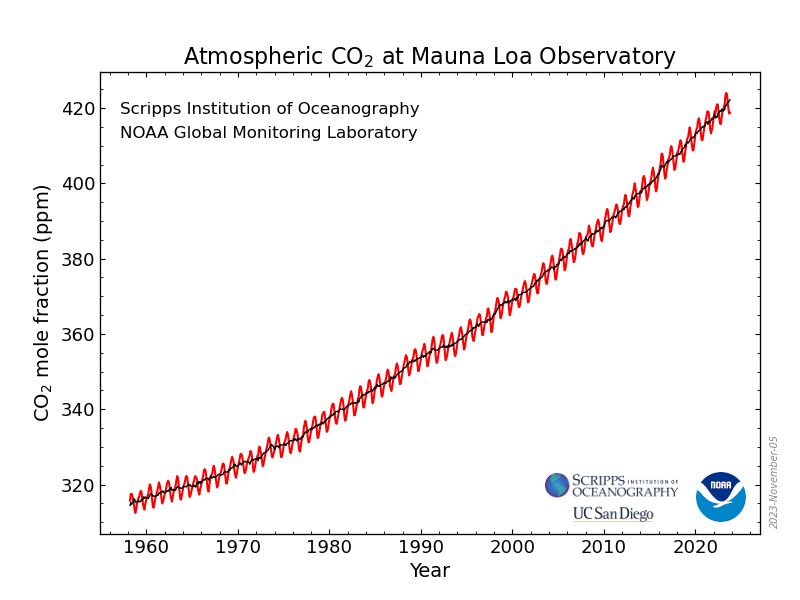
Like CO₂ and the Keeling curve, the EEI has a yearly cycle. This is due to the geographic differences between the Northern and Southern hemisphere. The South is dominated by oceans whereas the North is dominated by land masses. Because Oceans absorb incoming solar far more readily than land, during the months November-March (longer days in the Southern Hemisphere) the EEI is substantially positive, whereas during the months May-August (longer days in the Northern Hemisphere), the EEI is substantially negative.
Also like carbon dioxide which continues to accumulate over time, the EEI creates an ongoing aggregation of heating of the Earth system. The heating is long lasting and compounding. It follows that we should not be graphing the EEI according to its 36-month running mean (in units W/m² or HpS), but rather, the EEI should be plotted as “accumulated total heating.” And the best unit to measure this heat is the new unit GHB introduced above.
And so, I give you the “Keeling Curve” for the Earth Energy Imbalance:
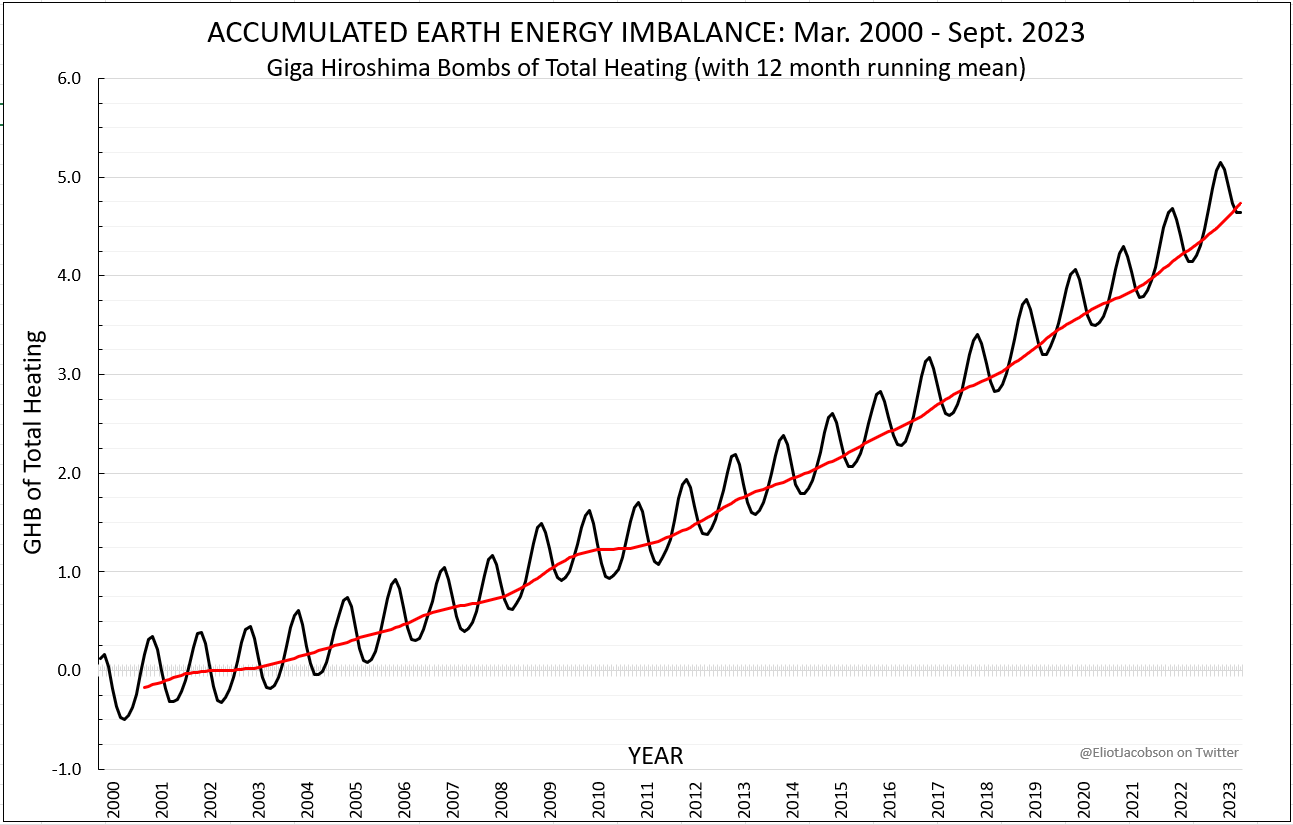
Pretty cool, huh? Treating 1 GHB as equivalent to 1 unit of global planetary f&%kery, the curve above shows us exactly how f&%ked we are, to the actual f&%k. Right now we are just shy of five f&%ks in accumulated f&%kery since 2000.
It is worth noting that, just like CO₂ didn’t start accumulating in 1958, the EEI didn’t start accumulating in the year 2000. If you run the curve backwards using quadratic regression, the decade of the 1920’s shows up as the beginning of net positive EEI accumulation. Integrating under the curve shows that from the 1920’s through the time data collection began in 2000, about 0.4 GHB of additional heating took place, putting the planet at well over 5 GHB of total heating, and rising. I.e., F&%k F&%k F&%k F&%k F&%k. Of course, this is speculation, but it sounds about right.
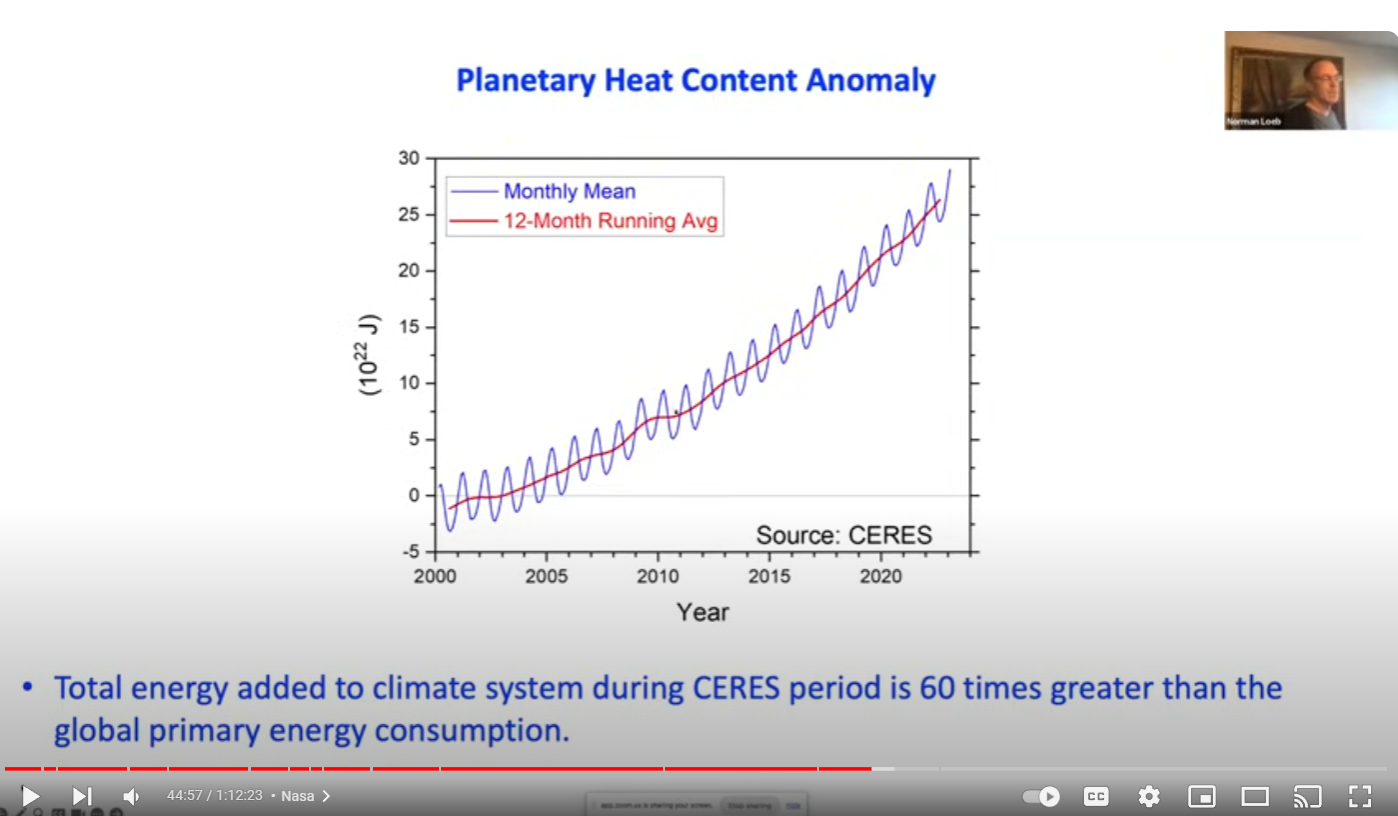
NOTE ADDED: Nov. 25, 2023. I was just re-watching the recent James Hansen video on YouTube and saw the slide below, which is exactly what I have reproduced above. So this is not my own original work — somewhere I recalled this and reproduced it, thinking it was original. It is not. The only original contribution is converting this to GHB, and maybe the explainer is helpful as well.
So, the official name for this is “Planetary Heat Content Anomaly.”
How can we possibly have had 4.630.000.000 Hiroshima bombs of energy added to the earth? Each one can flatten a city. This is one for every 2 people – so why is the damage not greater still?
About 90% of them have gone into heating the oceans. Another large percentage is used up melting ice (glaciers & poles). Another part is used up heating land. And a small fraction heats the atmosphere.
If this old doc may be so bold, the 1.2 trillion tons of melting global ice is absorbing approx. 2 ZJ of mostly human generated heat energy annually, from fossil fuel burning and GHG/Greenhouse trapped heat, and, by comparison, the oceans are already holding 20 ZJ of global heat energy. So, we are currently adding another 10% of the already accumulated mostly human generated heat energy in the latent state every year. So, total currently of 22 ZJ and adding at least another 2 ZJ every year, and doubling the total every 10 years, of so. Isn’t that a huge increase in HbS/EEI in the very near future? Isn’t that another hockey stick curve in the making? And doesn’t geophysics demand that a global heat retention equilibrium, latent and otherwise, be maintained? The Miklashek/Jacobson curve?
Ans.: melting ice and warming oceans. So, the real question is when will the ice run out? 2,138, is my calculation, and, then, Venus 2.0.
Thanks Eliot. This is cogent and useful. Thanks for the GHB unit, which is incomprehensible.
It looks like the good news is the oceans should stabilize the temperature around the boiling point of water and stay there for a while giving us a multiple Windows Of Opportunity (WOO) to act.
Delicious! A man after my own heart and a tribute, so wonderfully humorous, to Eliot’s work on our behalf.
You should team up with a vfx pro to create a timelapse video of a globe showing these “explosion equivalents” as flashes or pinpoints or bulleyes, based on the actual size of the Hiroshima explosion, starting at year 2000. Even though they would be placed randomly on the globe, it would be very interesting to see what 4.63 GHB looks like, graphically.
Nothing at all contributed by the thermal energy released by combustion of fossil fuels? I imagine that would amount to a GHB or two over time.
I envisage a small adjustment/refinement of the Accumulated Earth Energy Imbalance Curve (AEEIC), though I realise that the number of F&%ks thus accounted for will not be enough to change the message from your post.
We should call this The “Jacobson Curve.” for EEI.
We live in an interesting time. We will se civilisations rapidly collapse before our eyes.
The Jacobson nuke curve should cover it….
Thank you for another heart-felt effort to awaken the sleeping herd, but you seem to have omitted a central issue, that of the latent heat stored in the 1.2 trillion tons of melting ice annually. Has that massive amount of absorbed mostly human generated heat energy been included in the EEI/GHB calculation? What is clear to even the casual observation of this old retired psychiatrist/physician/stress researcher, is that our earth’s AC has been running on high for some time now and has an expiration date: 2138, at which date or there abouts we become Venus 2.0. I know, I know, I should just stick to the workings of the human mind, but sometimes the incessant curiosity of an old man just gets the best of me. A David Kelly on Quora calculated that 363 X 10 to the 15 MJ is being stored in the melting ice. Does your GHB/EEI number include that? All the best! Gregg
Is this calc about right?
Area: A = 510000000000000
Gain: G = 1.6W/m2
pop: P = 80000000000
WattsPerHuman: = A x G / P = 10200 = ~10kW
If we had some sort of magic non-polluting energy supply and the world was also actually currently in balance to get same Earth Energy Imbalance each human (man,woman,child, and baby) would need to switch on an 10kW heater and leave it on permanently while they are living. Oh, and this 1.6W/m2 is probably a bit low currently as it’s the running mean.
The current imbalance generated now is from previous pollution burning/releasing carbon.
According to this 2015 paper by Xiaochun Zhang, Ken Caldeira:
https://agupubs.onlinelibrary.wiley.com/doi/full/10.1002/2015GL063514
burning enough coal to make one cup of tea may release enough pollution over the next 1000 years to generate heat the equivalent of making >100,000 cups of tea.
(I may be a bit off with my interpretation of this paper here so don’t trust this, read it and make up your own mind.)
See the “addendum” to this post:
https://climatecasino.net/2022/05/earth-is-heating-at-a-rate-of-1150000-hiroshima-bombs-every-day/
Many thanks Eliot – I hadn’t seen that.
Who would have thought that there were so many people desperate for coiffered hair.[quote]The current EEI is equivalent to 446,100,000,000 hand-held hair driers running on high (1875 Watts)[\quote]
Very nice. Call it a four blanket bed for Planet Earth. Question is, how long for the blankets to warm you up.
Eliot, I am starting to believe we ain’t going to undo this easily.
I suppose it’s time to get cracking on geoengineering solutions since we seem to have little interest in reducing GHG emissions.
How confident are we in the EEI calculation? How big are the error bars?
To the uninformed, a quadrupling of the EEI in 20 years is an extraordinary claim, and as we all know, such claims require extraordinary evidence.
I just saw a great rcent video explanation from one of the folks who runs CERES. This will answer your question much better than I ever could. If you look at the first slide he shows, the error bars are listed in the box on the upper right.
https://youtu.be/NXDWpBlPCY8?si=1fUV3FnXtilITsgN&t=2546
I wonder why the monster lurking at the end of this curve is so rarely mentioned. Even if all climate-damaging emissions were stopped now (nobody expects that), there would still be a positive imbalance until the planet has heated up enough to completely offset the input of energy by radiation.
There would therefore be an unavoidable but predictable further heating.
Without feedback effects and without further artificial interventions – how much would this be?
The GHB unit might be compared to the GHB’s that are estimated to have been released with the asteroid impact off of Yucatan. How many years will it take, given the GHB rate, to reach an equivalent rate of energy?
Wikipedia (at https://en.wikipedia.org/wiki/Chicxulub_crater) cites 72 teratonnes of TNT (300 ZJ) for an estimate of the kinetic energy of the Chicxulub asteroid’s impact of ~66 million years ago, and (at https://en.wikipedia.org/wiki/Little_Boy) cites 15 kilotons of TNT (63 TJ) for the explosive energy of the atomic bomb that struck Hiroshima in 1945. Using these figures, (300 ZJ/Chicxulub asteroid)/(63 TJ/Hiroshima A-bomb) ~= 4.8×10^9 Hiroshima A-bombs/Chicxulub asteroid, or roughly 4.8 GHB/Chicxulub asteroid, which, coincidentally, almost exactly matches the 5 GHB figure that Eliot Jacobson calculates (above) for the total heating that has resulted from the Earth Energy Imbalance between the 1920s and late 2023. So, we now have a sense of what 1 Chicxulub/century looks like.
Thank you for this calculation!
You’re welcome! Thank you for all your number crunching, and for putting your results into some kind of understandable context, such as the GHB unit. And thanks to Elkobri for asking how an astonishing figure like 5 GHB of cumulative EEI compares with the Chicxulub asteroid impact.
Hello, thank you, do you know Meer ? Mirrors Earth Energy Rebalancing ? Doctor Ye Tao ? He calculated what should be done and it is excellent: http://www.meer.org . Now WE must build this engineering and finance it. WE must convice billionnaires the best investissement in this way.
Excuse me, I read, on an other page of the blog, that you know http://www.meer.org . May be if WE share the knowledge with people who have public audience and fortune, … show business, sports, … We’ll influence the powers ?
If I read this correctly, the amount of energy accumalated in the earth this past 100 years is approximately the same as the energy due to the asteroid that struck earth 66 million years ago!
Brilliant observation!