April 8 quote by Naomi Klein does it for me. .. bit by bit, hour by hour, day by day,…
Climate Change

The Long and Winding Road to CO2e
If a calculation is correct, then all roads should lead to the same answer. That is, unless the road is a ditch, a dead-end or a cliff. And so, let us begin our pothole-filled journey together on the road to computing the current value of CO2e, otherwise known as CO2-equivalent, the current atmospheric level of the totality of greenhouse gasses, if each were converted to an equivalent amount of CO2.
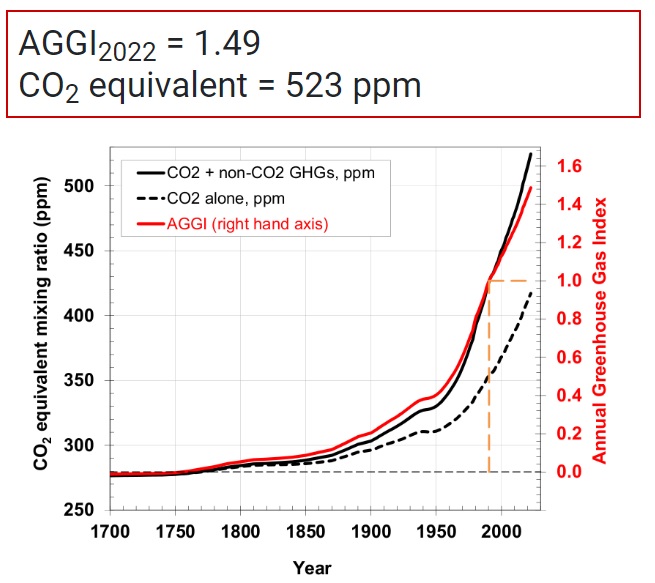
In all of what follows below, I was guided by trying to reconstruct the computation published by NOAA, showing CO2e = 523 ppm as of May, 2022. Spoiler alert, I failed. Kind of.
It’s helpful to have a definition. Here’s the one I’m going with (click for source):
Definition: Emissions of greenhouse gases are typically expressed in a common metric so that their impacts can be directly compared, as some gases are more potent (i.e., have a higher global warming potential) than others. The international standard practice is to express greenhouse gases in carbon dioxide equivalents (CO2e).
In this definition, there is reference to another number, called the “global warming potential” (GWP) of a greenhouse gas. The GWP is the force that takes us down the road. So, what is GWP? We need another definition:
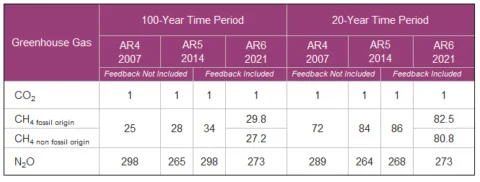
Definition: Starting in 1990, the Intergovernmental Panel on Climate Change (IPCC) used the Global Warming Potential (GWP) to allow comparisons of the global warming impacts of different gases. Specifically, it is a measure of how much energy the emission of 1 ton of a gas will absorb over a given period of time, relative to the emission of 1 ton of carbon dioxide (CO2). The time period usually used for GWPs is 100 years.
For example, from the latest IPCC report (ar6), methane has a GWP over 100 years of about 28 (click for source). What this means is that an emission of 1 ton of methane today will warm the planet over the next 100 years about the same amout as 28 tons of CO2. So, for methane, GWP(100) = 28. This is a weight-to-weight conversion.
It is very important to note that since CO2 and methane have different molecular weights, this multiplying factor cannot be directly applied to the atmospheric concentration of CH4 (in parts per billion). In other words you cannot simply multiply the atmospheric concentration of methane by 28 to get an atmospheric concentration of CO2 (in parts per million).
Similarly, the GWP for nitrous oxide (N2O) over the next 100 years is about 273. This means that 1 ton of N2O emitted today will warm the planet over the next 100 years about the same as 273 tons of CO2. For N2O we have GWP(100) = 273. Again, this is a weight-to-weight conversion, not a number that can be directly applied to the atmospheric concentration.
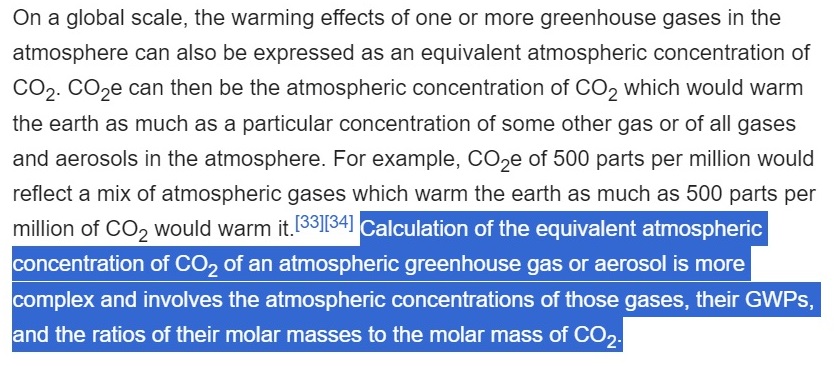
In the Wikipedia article on CO2e, there is a caution about calculating CO2e, specifically referencing the need for care when using these numbers:
Anyway, let’s note some values for GWP. For methane, with a relatively short half life of about 110 months, we can see the quick decay in the GWP numbers:
- GWP (20) = 81
- GWP(100) = 28
So, 1 ton of CH4 emitted today and viewed over the next 20 years, has the same impact on global temperatures as 81 tons of CO2 emitted today. But over the next 100 years, that ton has the same impact on global temperatures as 28 tons of CO2.
For nitrous oxide, the constant value reflects the long atmospheric lifetime, similar to that of CO2.
- GWP(20) = 273
- GWP(100) = 273
There are lots of other greenhouse gasses that contribute to global warming, with a host of GWPs. For example, the other GHG mentioned on the NOAA website is SF6. It has a GWP over 20,000. But, because this gas is measured in parts per trillion, the net contribution to CO2e is very small.
The Rocky Road to Nowhere
Okay, it’s time to go down the very rocky road I travelled in my search for the computational methodology for CO2e. This adventure starts with an image from a short paper by Andrew Glikson from 2019:
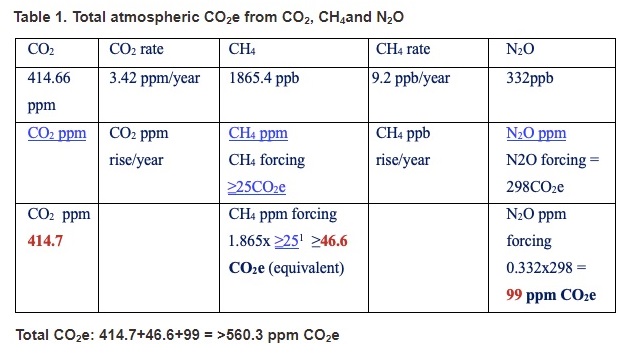
This computation is based on 2019 data, with CO2 = 414.66 ppm, CH4 = 1865.4 ppb and N2O = 332 ppb. Glikson determines that CO2e is at least 560.3 ppm! Let’s make sure we understand what Glikson did here.
First he converted everything into parts per million. So:
- CO2 = 414.66 ppm
- CH4 = 1.8654 ppm
- N2O = 0.332 ppm
He then used the values of GWP(100) for CH4 and N2O that were the latest values from the IPCC at the time. Namely he used GWP(100) = 25 for CH4 and GWP(100) = 298 for N2O. He then did a quick multiplication:
- CO2e from CO2 = 414.66 x 1 = 414.7 ppm
- CO2e from CH4 ≥ 1.8654 x 25 = 46.6 ppm
- CO2e from N2O = 0.332 x 298 = 99 ppm.
Finally he added it all up and got:
CO2e ≥ 414.66 + 46.6 + 99 = 560.3 ppm.
Stare at this a moment and see if you can tell what he did wrong. This road contains a ditch, a cliff and a dead-end. One error is easy to spot, the second is hard, the third is very hard.
1st mistake
Okay, here’s the first mistake, the easy one, the ditch. Glikson did not consider the mass of the gasses in applying the GWP. He only considered the number of parts per million, not the total weight! That is, he made exactly the mistake I pointed out when I defined GWP above. You simply cannot multiply ppm of a greenhouse gas by its GWP to convert it to its equivalent ppm of CO2e.
2nd mistake
Here’s the second mistake, the cliff. This one is tougher. Did you spot that Glikson used the ≥ symbol in his computation? That’s because he knows that GWP(100) is only a long-term number, it does not represent the current warming impact of the CH4 in the atmosphere today. Maybe he felt that if he used GWP(20) = 81, that his answer would be so absurdly large that it had to be wrong, so he stayed with GWP(100). But what we need is GWP(0) — the instantaneous warming equivalence of the methane that’s in the atmosphere right now.
3rd mistake
And here’s the third mistake, the dead-end. This one’s the toughest. Why is Glikson using the full values of the GHGs here for methane and N2O? Shouldn’t CO2e be based on the gain since pre-industrial values? Is there a baseline convention already in place? WDND (what did NOAA do).?
One final note for the astute reader. There’s another huge hint that something is wrong with Glikson’s computation. Namely, his computation gives a warming impact from N2O that’s greater than the warming impact from CH4. But it is well-known, even among young children, that methane is the #2 greenhouse gas. So bzzzt!
If you ever see Glikson’s work quoted, just know it is wrong. However, Glikson’s work also serves as a guidepost for what we have to do to get it right. First, we need to solve the issue of weight versus ppm. Second we have to figure out how to get the instantaneous warming impact of the current concentration of methane. In other words, we need to compute GWP(0) for methane. Third, we need to identify and use baseline values.
Fixing the 1st mistake: weight vs. parts-per-million
Not all molecules have the same weight. If we say that one ton of methane has the same warming impact as 28 tons of CO2 over the next 100 years, that also says something about the number of molecules of each. Namely, over the next 100 years, the number of methane molecules in one ton of methane has the same warming impact as the number of CO2 molecules in 28 tons of CO2.
Without getting too technical, we need so-called mole-fraction conversion ratios, referenced in the Wikipedia article above. We need to know the relative weight of one molecule of CH4 compared to one molecule of CO2, and similarly for N2O. You can easily ask Google for these weights, here’s what you get:
- CO2 has molecular weight 44.01
- CH4 has molecular weight 16.04
- N2O has molecular weight 44.013 (surprisingly close to CO2!)
And here are the mole-fraction ratios:
- CH4/CO2 = 16.04/44.01 = 0.364.
- N2O/CO2 = 44.013/44.01 = 1.000
Fixing the 2nd mistake: GWP(0) for methane
Okay friends, this is the one that took me the longest to get right. I re-did this computation at least 4 times. The first time was just to check I knew how to do it. The next three times were based on updates to the GWPs I was using from various sources. But, in the end, my computation resulted in exactly the same value that I have recently heard other people (Dan Miller, Paul Beckwith) state without reference.
For methane, the instantaneous warming potential is:
- GWP(0) = 120
That is, 1 ton of atmospheric methane emitted today has the same warming influence as 120 tons of CO2 emitted today, over the next instant of time.
How did I get this result? I used exponential decay for methane, and the fact that GWP(t) is the integral from 0 to t under an unknown exponential decay curve. Using GWP(20) = 81 and GWP(100) = 28, I computed the integrals to get two equations in two unknowns. Sovling for one of the unknowns required getting a root of a 5th degree polynomial, for which I used Wolfram Alpha. Plugging in this value into one of the two initial equations allowed me to solve for GWP(0), which gave GWP(0) = 119.94.
If you want to see my computation, click here: Derivation_of_GWP(0)
Fixing the 3rd mistake: baseline values
If you look at the image shown in the first graphic above from NOAA, you will see that it goes all the way back to the year 1700. And, at that point in the graph (and any time before 1750), none of the other GHGs are contributing to CO2e. These gasses were definitely present. So why are they zero’d out in the graphic from NOAA before 1750? Because NOAA used 1750 baseline pre-industrial values for these GHGs when they computed CO2e.
Here are the 1750 baseline values for the major greenhouse gasses used by NOAA (click for source):
- 1750 baseline CO2 = 277 ppm
- 1750 baseline CH4 = 731 ppb
- 1750 baseline N2O = 274 ppb
Example with no mistakes (I hope)
So, for example, if CH4 is currently at 1932 ppb and was at 731 ppm in 1750, then the net gain is 1201 ppb, which is 1.201 ppm. That has weight 1.201 x 16.04 = 19.264 (ignoring units). Since GWPs are a weight-to-weight conversion, multiplying this by GWP(0) gives 19.264 x 120 = 2312 weight units of CO2. Dividing this by the weight of CO2 gives:
CO2e = 2212/44.01 = 52.5 ppm.
That is, the contribution from methane to the current level of CO2e is 52.5 ppm.
Another way to do this computation is to see that we are multiplying by 16.04 and later we are dividing by 44.01. In other words, the net result is to multiply by the fraction (16.04/44.01) = 0.364, the mole-fraction ratio referenced above.
Final confirmation (or not) of NOAA’s results
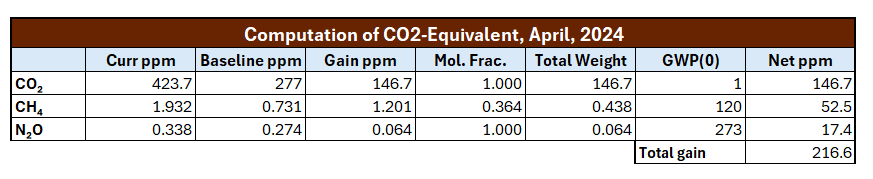
Okay, let’s put this all together and compute how much in CO2-equivalent has been added to the CO2 baseline since 1750. The full computation is given in the spreadsheet image below. Here’s a column-by-column breakdown:
Curr ppm: the current parts per million of the given GHG, from this source. Notice that I used the most recent global CO2 rather than the Mauna Loa CO2.
Baseline ppm: this is the amount of each GHG in the atmosphere in 1750, according to this source.
Gain ppm: this is just the ppm gain from the baseline to the current value for each GHG.
Mol. Frac: these are the molar fractions, as described above.
Total Weight: maybe this isn’t the best title for this column. This is simply the result of multiplying the gain by the Mol. Frac. value.
GWP(0): the instantaneous global warming impact for the GHG. Note the value for methane is 120 as we computed.
Net ppm: the total contribution to CO2e from the GHG in that row. Note the value for methane is 52.5ppm, just as we computed above.
And when we add all the values together on the far right, we get a total gain of 216.6 ppm over the CO2 baseline value of 270 ppm.
That is, the current CO2e, just including CO2, CH4 and N2O in the calculation, is 277 + 216.6 = 493.6 ppm.
Okay, so I got a value of CO2e = 494 ppm using 2024 data, and NOAA’s value from 2022 was CO2e = 523 ppm. Did I fail?
The first reason I didn’t fail is that the GWP’s assigned by the IPCC to CH4 and N2O have changed slightly over time and are often expressed as a range of values. Given these changes and ranges, the final value for CO2e obtained using GWPs, namely 494 ppm, should also rightfully be expressed as a range.
The second reason I didn’t fail is that there are many other GHGs that fall into the broad category indicated in the graphic that belong to the “non-CO2 GHGs” category. For example, according to the graphic below from NOAA, the contribution from the halogenated GHGs easily exceeds the contribution from N2O.
My computation shows the right way forward, based on conversion from GWPs to CO2e, using molar fractions, GWP(0) and 1750 baselines. A full accounting of all GHGs, GWPs, and their ranges, will surely get us all the way down the road to 523 ppm, no ditches, no dead-ends and no cliffs.
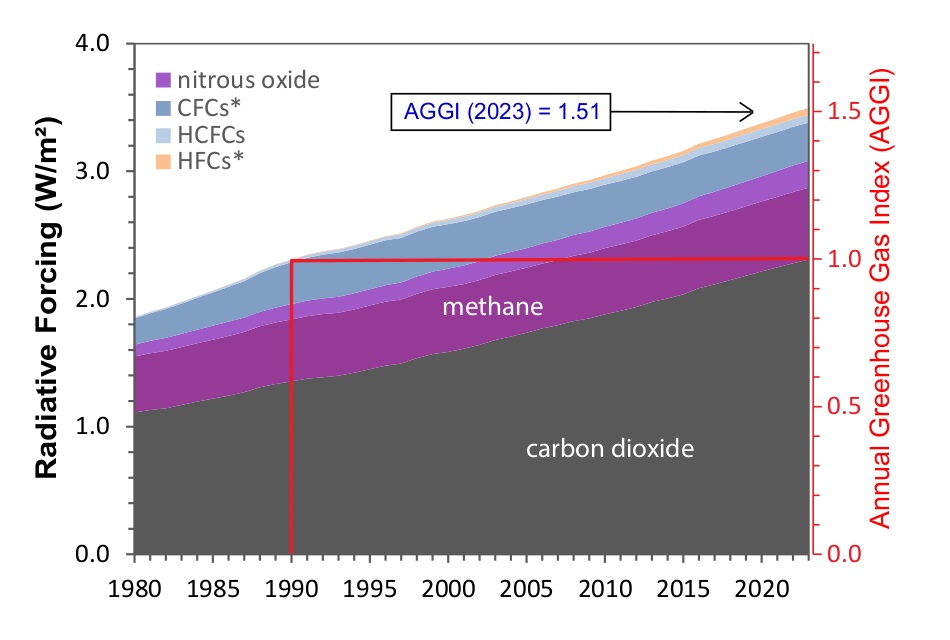
But the method above is just one method. There is another independent way of doing this calculation which leads to nearly the same result. That method involves the data in the graphic above, showing the total radiative forcing, and a conversion to CO2e based directly on radiative forcing alone.
The Radiative Forcing Method to Compute CO2e
Radiative forcing is the net heating impact, in Watts per square meter (W/m²), caused by all the various things that heat and cool the planet. When we restrict this forcing just to the heating caused by GHGs, then the graphic above shows that the rate of heating is, visually, roughly 3.4 W/m². So, how do we use this to get CO2e? We use the Stefan-Boltzmann law (I confess to not remembering this from college physics, 48 years ago). This quote from the Wikipedia article on radiative forcing is key:
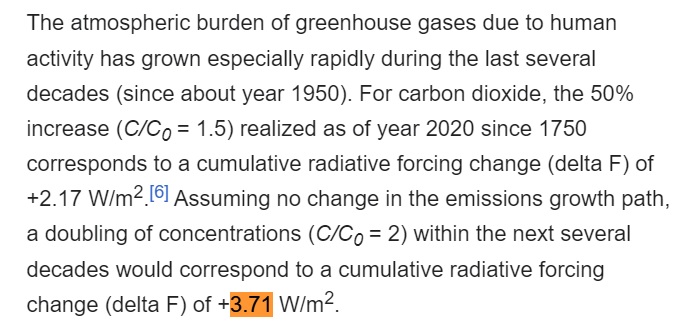
Another way of saying this is that there is a direct relationship between radiative forcing and CO2e, where 0.00 W/m² in radiative forcing corresponds to the baseline value of CO2 from 1750, and 3.71 W/m² in radiative forcing corresponds to doubling the pre-industrial atmospheric concentration of CO2.
Now, let f(t) be the function that converts from W/m² in radiative forcing relative to the 1750 baseline to CO2e level. Then we have these two data points:
- f(0) = 277.15
- f(3.71) = 544.30
We also know this function grows logarithmically. It is straightforward from this to construct the unique logarithmic function that passes through these two data points. That function is:
f(t) = 385.42×ln(t/3.71 + 1) + 277.15
Let’s go ahead and use this function to figure out some values for CO2e, using the more up-to-date Copernicus data for 2023 on radiative forcing, available here:
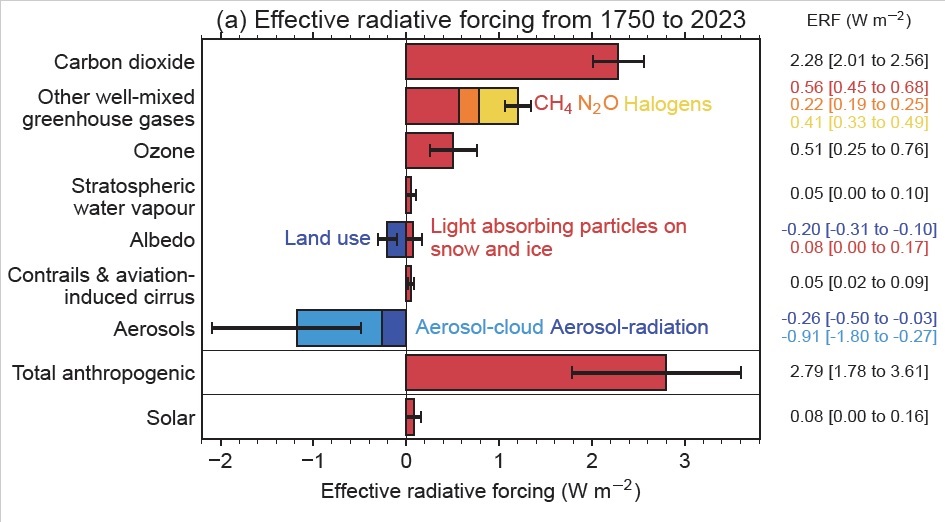
If we compute the cummulative radiative forcing from just CO2, CH4 and N2O from this graphic, using the midpoint of the error bars, we get that the radiative forcing in 2023 is 2.28 + 0.56 + 0.22 = 3.06 W/m². Plugging this into our function above, we get
f(3.06) = 508.97
That is, as of 2023, this method gives the value:
CO2e = 508.97 ppm.
While that’s close to our value of 494 ppm, it’s definitely higher. But note that this method of computing CO2e has large error bars for the radiative forcing for each GHG. If we compute the range of radiative forcing from just CO2, CH4 and N2O, the value lands somewhere between the low value in the errors bars of 2.01 + 0.45 + 0.19 = 2.65 W/m², to the high value in the error bars of 2.56 + 0.68 + 0.25 = 3.49 W/m². Plugging this into our function gives:
f(2.65) = 484.89
f(3.49) = 532.70
This leads to an error bar for using this method to compute CO2e that ranges from 484.89 ppm to 532.70 ppm.
Wow! Look at that! Yay! We have confirmation!
The first method, based on GWP and restricted to CO2, CH4 and N2O, gave CO2e = 494 ppm (which as we noted above should really be a range). The error bar using radiative forcing and restricted to CO2, CH4 and N2O is 484.89 ppm to 532.70 ppm. The first method gives a value that is inside the error bars for the second method!
It is just very gratifying to have these line up. Pardon me while I exhale.
Even More Well-Mixed Greenhouse Gasses
Next, let’s include the halogens. Taking the midpoint of the radiative forcing from well-mixed greenhouse gasses (the top 4 values), we get an effective radiative forcing as of 2023 of 2.28 + 0.56 + 0.22 + 0.41 = 3.47 W/m². Plugging this into our logarithm function above, we get:
f(3.47) = 531.63
We conclude that the 2023 estimate for CO2e, based on the totality of well-mixed greenhouse gasses (CO2, CH4, N2O and halogenated GHGs) is:
CO2e = 531.63 ppm.
And Some Other Gasses
If we go one step further and also include tropospheric ozone and stratospheric water vapor then we get a total radiative forcing of 4.03 W/m². Plugging this into our function gives:
f(4.03) = 560.58
Caveat: I’m not fully comfortable with doing this — tropospheric ozone has a half-life of 20-30 days, is not a well-mixed GHG, and has very localized warming impacts that can vary significantly over short periods of time. Likewise, water vapor is not properly an emitted greenhouse gas, its warming is a secondary feedback effect arising from the other gasses and its climatological impact is typically very strong, very short and very localized (e.g. storms). Finally, the ECS (equilibrium climate sensitivity), maybe the key number in all of climate science, is based on doubling CO2, which is based on the single greenhouse gas CO2. The further we get from GHGs and GWPs by virtue of including secondary cause-and-effect or feedback gasses, the less it makes sense to include the gas. I encourage the reader to do their own investigations of ozone and water vapor as GHGs for the purpose of computing CO2e.
But that’s right! Current CO2e that includes all forcing agents gives a value of CO2e over 560 ppm. Including tropospheric ozone and stratospheric water vapor leads to a value of CO2e that has more than doubled from its 1750 baseline value of 277. And isn’t that ironic. We get the same value that Glikson came up with. While Glikson’s methodlogy was wrong in at least 3 different ways, somehow it came up with the right answer. Even though 3 wrongs don’t make a right, three left turns do make a right turn.
So, What is the Answer? What is CO2e in 2024?
I computed CO2e using the major GHGs (CO2, CH4 and N2O) in two different ways, coming up with the values 494 ppm (2024 value, using GWPs) and 508.97 (2023 value, using forcing). It’s clear that halogenated GHGs should be included in both computations. The 2023 value that includes halogenated GHGs using radiative forcing is: CO2e = 531.63. The 2022 value including halogenated GHGs using GWPs is CO2e = 523 ppm (from NOAA).
But it’s 2024 now, so my best guess for CO2e using CO2, CH4, N2O and halogenated GHGs is somewhere in the range of 535 – 540 ppm.
End Note
This is a work in progress. If for some reason I have taken the wrong road here, if I have made some fundamental mistake, please let me know in the comments. It is never too late to change directions.
And, a special shout-out to Leon Simons for bringing radiative forcing to my attention, especially in its use as a secondary method to compute CO2e.
Great article. Very clear. Thank you! It would be interesting to calculate the Co2e in 1750 and now. And to see the ratio between both. Can we apply climate sensitivity to that ratio?
Well, since 1750 was the baseline year, CO2 = CO2e = 270 ppm in 1750.
If you want to include all GHGs in the 1750 baseline at their value and GWP at the time, then CO2e would need to include the full amounts of GHG’s today.
Exactly, I got CO2e 1750 = 383,7 CO2e 2024 = 600,4 Ratio 1,565
A little over CO2 1750/ CO2 2024 (1,53)
I only included CH4 and N2O. Don´t have the data of the other GHG preindustrial. But if they weren´t present preindustrial the ratio will increase to 1,64.
Eliot — you said a few months ago that we would know by August if we were reducing ghg or not and if “net zero” was dead. I can’t remember what data that referred to but can you report on that?
I was quoting Gavin Schmidt, but also agreeing that August was a hard-barrier for things to start going down.
And — global temperatures have moderated quite a bit, sea ice is 2nd lowest (not first) in extent, SSTs are also now 2nd lowest, and EEI has come down quite a bit. So I’d say we are not in short-term doom quite yet, but more data is coming in all the time.
Thanks for remembering and asking the question.
I know you’re a self-proclaimed doomer but this seems like huge positive news. Is this the result of recent mitigation efforts, energy policy, other? I thought renewables were an add-on to fossil fuels and ff use is still increasing (though at lower rate)? Thanks for all you do! 🙏❤️
I honestly don’t know what the good news is here. We’re at 530+ for CO2e (not including Ozone) and rising fast. But yes, all those things you mentioning are slowing the pace from where it would be without them.
Thanks for working through the calculations – since 2015 when realised collected Gov response to CC not like Montreal Protocol have struggled with seemingly random choice for reports between ppm CO2 atms CO2 (E) and baselines of 1750 “pre-industrial” 20th cent average etc. for changes in any component, temp, energy imbalance etc – Good to verify logic behind components of main driver! Thanks again.
Why isn’t the increase in atmospheric water vapor compared to 1750 baseline also included in the CO2e calculation?
I just put it in, using Copernicus data. See the end of the article.
You lost me, Eliot, as I have come to understand that 1 trillion tons of water vapor are being evaporated from the earth’s surface every day and that it only stays in the upper atmosphere for 10 days, so 10 trillion up there at any one time. We can see with our own eyes the consequences in precipitation increases, leading to flooding and dam bursts, as well as mega-droughts, and mega storms. This only makes common sense as the 321 million cubic miles of oceans are heating and we’re seeing record ocean temps. So, forgive me, but your hidden calculations for the CO2e of water vapor and the combined number barely changed from the inclusion of water vapor just doesn’t “compute”. Glad to see you posting again and I’ve been missing your efforts, which seemed to stop last June. Many other sites point out that water vapor is the largest contributor to GHGs.
If I am doing the math right, I calculate that the additional water vapor at +1.5°C adds ~100ppm CO2e.
If H2O vapor accounts for ~55% of GHG, & there’s ~2500ppm atmospheric H2O, & it ⬆️7%/°C, & now ~1.5°C over baseline –> ~+260ppm. Molar correction 18/45 –> ~106ppm CO2e.
It is not this simple with water vapor.
Atmospheric H2O creates clouds. Some clouds cool, some warm. Some mostly reflect incoming solar, some mostly trap outgoing thermal. The type and distribution of clouds makes a huge difference. Also, more atmospheric H2O creates more precipitation, and that also cools the planet.
Because of all of these short-term impacts both cooling and warming and all that is unknown about clouds, H2O is not included in CO2e.
Hey, Eliot, I found two articles on the net, one from Climate Connections at Yale and the other from MIT.edu/ask. Both credit water vapor with a majority effect in global warming, “66-85 % of the greenhouse effect” (Yale) and “responsible for a major portion of earth’s warming” (Yale), but add that the GHGs you mention are the first causes and water vapor secondary. “CO2 is not the most important greenhouse gas affecting the Earth’s temperature” (MIT). So, you may wish to reconsider your dismissal of its importance. Thanks, again for your work and stimulating this discussion. Gregg
I have the greatest respect for you, Eliot, but water vapor is present throughout the earth’s atmosphere and is measured as “humidity”, not just as the visible clouds. Clouds, no doubt, only make up a fraction of the 10-14 trillion tons of water vapor in the atmosphere at any one time, right?
Yes, I am sure you have about the same amount of respect for me as you do for NOAA, since they also do not include water vapor in their calculation of CO2e.
https://gml.noaa.gov/aggi/aggi.html
I am surprised by your sarcastic reply to my attempt to dialog about the enormous amount of water vapor in our atmosphere that is not evident visually in clouds. I intended no insult, but you are correct in assuming that I have lost respect for NOAA in its omission of water vapor as the primary GHG. I documented my references, without sarcasm.
Then surely you have also lost respect for Copernicus, IPCC and James Hansen (et. al.), who use the resource that shows that stratospheric water vapor has added only about 0.05 Watts per square meter to global radiative forcing.
https://climatecasino.net/wp-content/uploads/2024/08/essd-16-2625-2024-f03-high-res.pdf
I think you have an agenda that doesn’t mesh with the facts on the ground. I advise you to please troll elsewhere. Thanks.
Great article. You took your time to describe in detail the process to calculate CO2e.
Thanks!
I’ve been working on this for a long time (at least in my mind) — finally got around to doing the math & writing it up.
Slight typo that might confuse some people:
“CO2e = 2212/44.01 = 52.5 ppm.
That is, the contribution from methane to the current level of CO2e is 52.5 ppb.”
Second should be ppm, just so people can follow that you aren’t doing an invisible conversion.
Great post, though. It’s good to double check these official numbers and make sure that we understand them ourselves so we can talk to others about them.
Thanks for your eagle eyes, I love that you caught this!
I thought I had fixed that typo — I saw it earlier. I’ll double check. There may be a problem with CloudFlare (or whoever) sending out cached versions with that typo.
Thanks Eliot as always.
please use the term “molecular weight” or better “molecular mass” for molecules . All GHGs are molecules, not atoms although they are composed of atoms.
I much prefer the term CO2e to “carbon” which is seriously misleading. It conflates soot and the carbon atom in methane which is irrelevant to GWP
Excellent point, thanks!
As usual you convey very complicated mathematic ideas into layperson’s, like me, language. Thanks Eliot!
Ecce!
The newly minted ‘Jacobson Equivalence’.
Brilliant.
Excellent. I too had made a pass at computing this back in 2019. While I didn’t copy Andrew Glickson, I shared some of his errors in one of my blog posts.
I am editing my post at https://1wow.org/triggers/climate/methane-amplifies-global-warming/
In doing so, I found I don’t see why your computation of the the current CO2e includes the 1750 value and increase since then for CO2, but only the increase for CH4 and N2O in the calculation.
Saying it is “277 + 216.6 = 493.6 ppm.”
You used the CO2 value for 1750, but not the baseline for CH4 (31.9) and NOx (74.8).
This looks to me as an inconsistency.
That’s true about the 1750 baselines — I explain why by reference to the NOAA image which zeros out the contributions of CH4 & N2O in 1750 and just tracks their rise since that point in time in terms of their contribution to CO2e.
Eliot,
I’m appreciating your mathematical work.
Can you please check this calculation?
[redacted link]
The author uses an exponential growth and the results are terrifying.
The primary author as well as the entire site are b.s., and have been b.s. for a very long time.
Thank you! Climate anxiety is real.
So many bad news from all over the world.
https://www.nasa.gov/earth/new-nasa-study-tallies-carbon-emissions-from-massive-canadian-fires/
My moment of doom today:
The 2020 arctic ozone hole was the largest ever.
http://atmosphere.copernicus.eu/cams-tracks-record-breaking-arctic-ozone-hole
And space debris from SpaceX Starlink is injecting many chemicals into the atmosphere.
Methane decline ain’t gonna happen:
https://www.carbonbrief.org/qa-why-methane-levels-are-rising-with-no-hint-of-a-decline/
We’re heading for +3C, sigh.