Fair question. Here are all the greenhouse gases with historical concentrations and projected out until 2500. https://gmd.copernicus.org/articles/13/3571/2020/
WTF Happened to the Methane Monster?
Two years ago methane was the rising star on the hitlist of doomer messaging. And it was easy: the methane monster had so many different heads to chose from. From natural sources we had permafrost methane, East Siberian Arctic Shelf (ESAS) methane, methane bubbling up from lake and ocean bottoms and from an increase in termites. From anthropogenic sources we had methane from pipelines, fracking, animal agriculture, rice farming, landfills, LNG leakage and more. Times were good for the methane-centric doomer. There was even a Nova documentary.
And then, about a year ago, it all stopped. The media moved on from methane to the next big shiny climate-change disaster. And there’s been a long list to chose from — Antarctic sea ice extent, global 2-meter temperature, sea surface temperatures, Thwaites glacier, fires, cyclones, floods, heatwaves, droughts. And *poof*, no one is talking about methane any more.
[Before you go on, I’ve been advised by a reader that you should read my article “Is the Methane Catastrophe Happening Right Now?” before continuing with the current one, or, at least, have some understanding associated with how methane gets scrubbed from the atmosphere.]
Methane is a greenhouse gas that is responsible for about one-third of the current rise in global temperatures from the 1850-1900 IPCC baseline. Unlike CO₂ which can persist in the atmosphere for millennia, methane tends to break down much faster. Depending on local atmospheric conditions, the over/under for the lifetime of a methane molecule is about 110 months.
Because methane breaks down so much faster than CO₂, curbing anthropogenic methane was viewed as a quick fix to buy time to do something meaningful about CO₂ without breaching the Paris limit. This strategy led to the so-called Glasgow Pledge, written in 2021, at the very end of COP 26. Here’s a summary:
“103 countries, including 15 major emitters, signed up to the Global Methane Pledge, which aims to limit methane emissions by 30 per cent by 2030, compared to 2020 levels…”
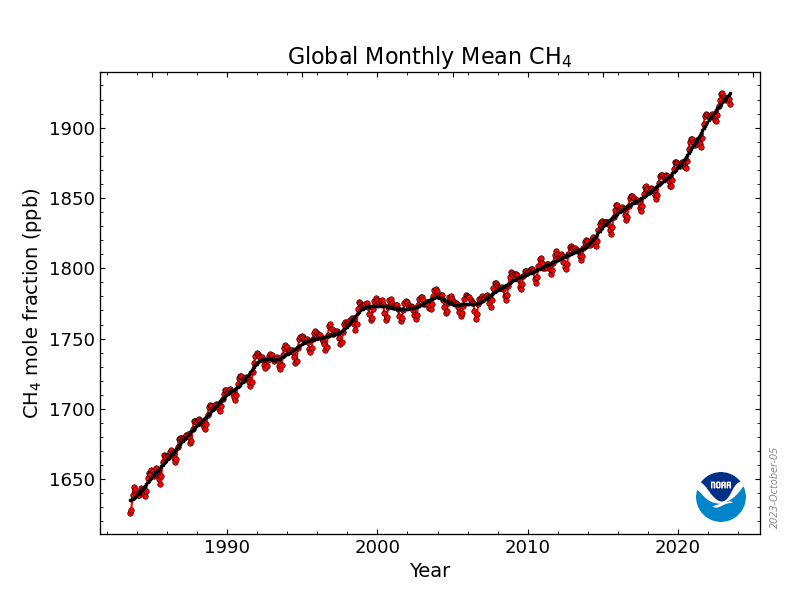
At the most basic level of data, total atmospheric methane keeps rising. The graph below from NOAA shows methane from July, 1983 through June, 2023. That’s 40 years. In that time, methane has risen about 300 parts per billion (ppb). And in the last 12 months alone, methane rose from 1905.19 ppb to 1917.11 ppb. There is little doubt that methane will exceed 1930 ppb by the end of the current 12 month cycle.
The next level of analysis is to see how fast methane is growing. The bar graph from NOAA below shows the annual global increase of methane. Unfortunately, this graph is only updated once a year, usually in April, to account for data from the previous calendar year.
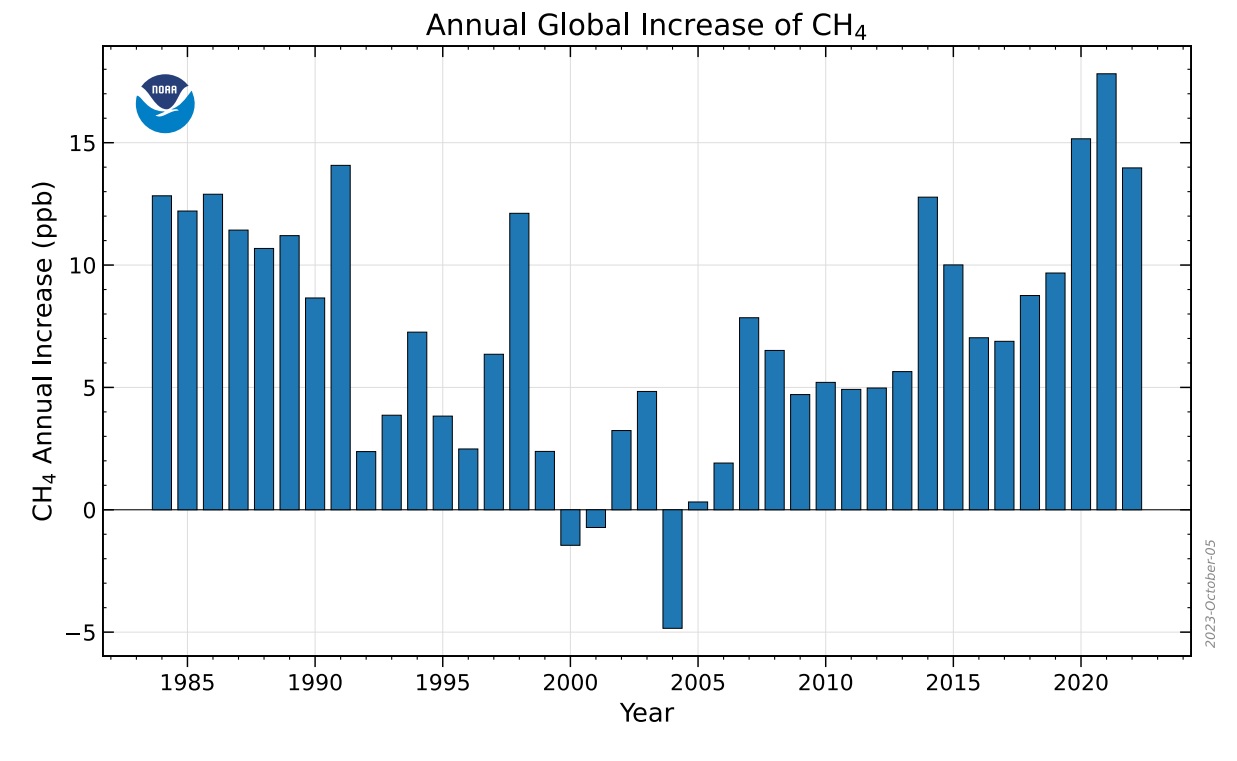
Although one of the most crude metrics available, it seems clear that the peak reached in 2021 was part of the reason for the global methane media and doomer freak-out. Methane appeared to be skyrocketing. And then we had COP-26 and the Glasgow pledge. And sure enough, a year later the data showed the start of the decline in the rate of increase of methane. So should we still be freaking out? Or has the methane monster been decapitated?
To find out, I’m going to re-do the NOAA analysis taking into account the atmospheric half-life of methane and resolving this on a monthly basis.
I want to take a moment to do a bit of simple math to illustrate the focus of my analysis. Suppose methane was 1905.19 ppb in June, 2022 and 1917.11 ppb in June, 2023. What really happened? How much methane was really added to the atmosphere? If you’re like NOAA, you just subtract the two numbers and come up with:
(1917.11 – 1905.19) = 11.92 ppb.
And then you say that methane grew by 11.92 ppb over the last year and you plot that point. But that’s wrong, and the reason it’s wrong is the short atmospheric lifetime of methane.
If methane has an average lifetime of 110 months, then after 12 months we should expect that original amount of 1905.19 ppb to be reduced by some amount of natural decay. To put it super simply, if you know the amount of methane in a given month, call it “old methane”, then the amount of methane that will still be present the following month is approximately given by:
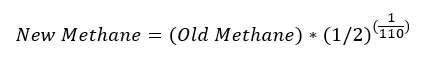
If we use this same formula for 12 consecutive months, starting at 1905.19 ppb in June, 2022, then that methane is reduced by natural decay to 1766.45 ppb by June, 2023. So, the only way we could get an actual reading of 1917.11 ppb in June, 2023 is for the amount of methane added to the atmosphere over those 12 months be:
(1917.11 – 1766.45) = 150.66 ppb.
So I re-did the NOAA chart above, using the fact that atmospheric methane is constantly decaying. I also used some smoothing to account for the natural yearly cycle, and I used their full monthly data, not just yearly numbers. Putting that together, here is my improved version of the NOAA chart:
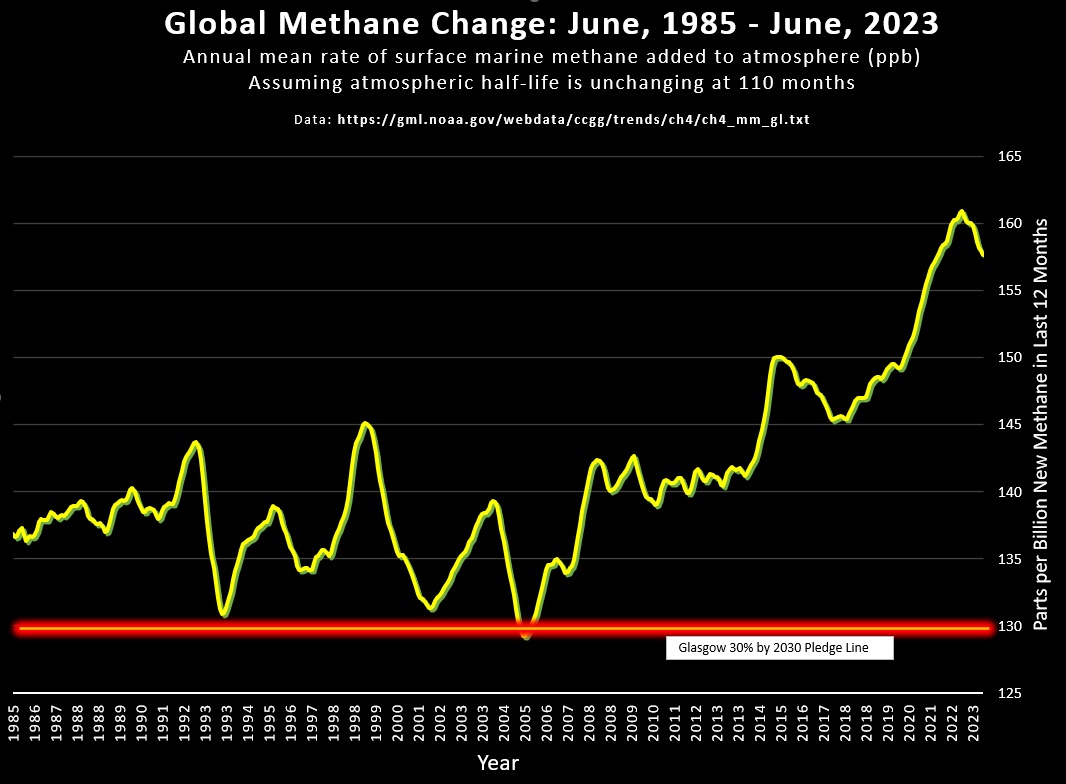
The orange line is the Glasgow Pledge — 30% by 2030. Do you think we’ll get there? Let’s find out what the math says.
Methane growth peaked in August, 2022 at an annual rate of 160.9 ppb. Since that time the rate of methane growth has been slowing down, and in June, 2023 it had fallen to an annualized growth rate of 157.7 ppb. The rate of methane growth has been slowing down for the last 10 months.
Let’s be clear here — the amount of methane in the atmosphere is continuing to rise. It’s the growth rate, the rate of increase of methane, that is decreasing, and because of this, eventually something interesting has to happen. And here’s the fun bit of math (for me, anyway): we can project this all into the future.
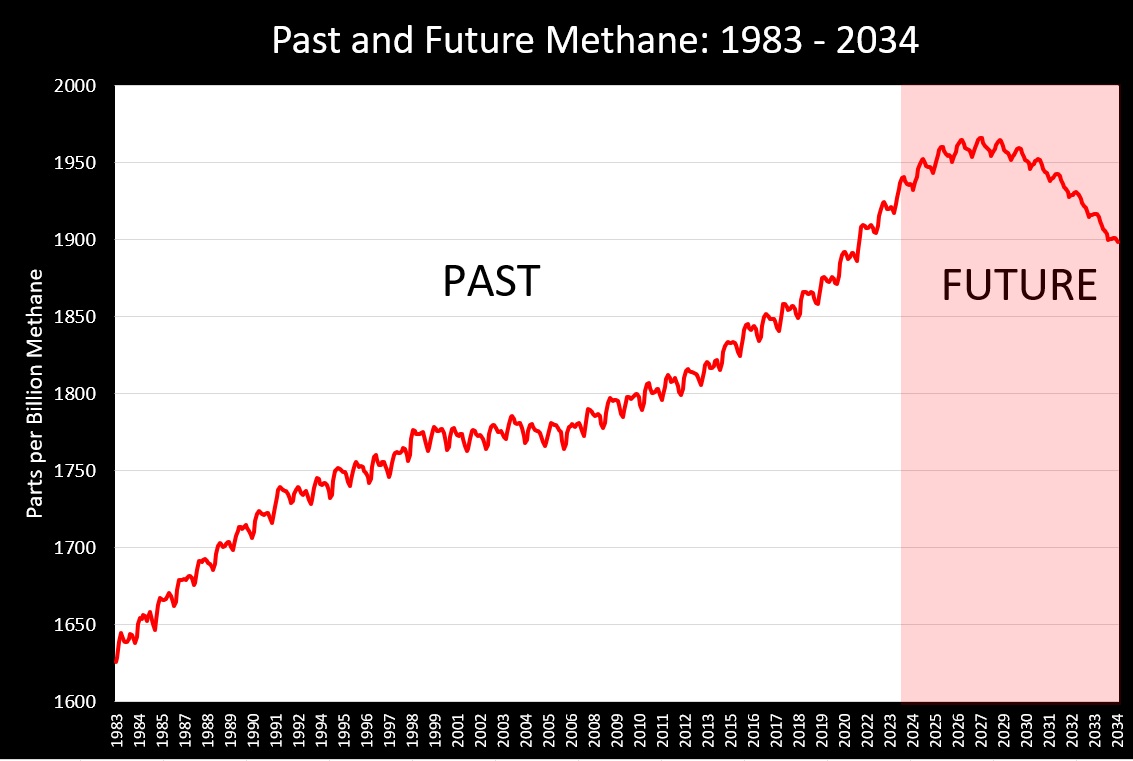
If the current slowdown trend continues, then methane will peak at 1966 ppb in November of 2027. Atmospheric methane will then gradually start to fall. We will reach the “Glasgow pledge” of reducing anthropogenic methane by 30% in September, 2032 (about 2 years behind schedule). By December, 2034, methane will once again be under 1900 ppb. The following graph illustrates this “prediction”:
Well fans, that’s more than enough fairy dust and mathemagic. Now for some reality.
The first big question is if the slowdown of methane growth is due to proactive climate actions that will eventually get us to the Glasgow Pledge, or if it is a consequence of something else. The answer? Bzzzttt. It’s something else. This formula explains it all:
Longer atmospheric lifetime for methane = more methane.
It is worth remembering that we had a lockdown just before that huge 2021-2022 jump. The massive rise in new methane may have been an artifact of the pandemic’s impact on air travel, which led indirectly to a longer atmospheric lifetime for methane and the appearance of a significant reduction when there was none:
Likewise, the tropical fires in Brazil, which have declined with Brazil’s new government, may have led to depleting hydroxyl radicals, the primary scrubber of atmospheric methane. Less hydroxyl = longer atmospheric lifetime = more methane.
I explore other potential reasons for the 2021-2022 peak having to do with a longer atmospheric lifetime for methane in this article.
The second big question is if ESAS, permafrost, or some other natural source of methane is going to light off, instigating a multi-gigaton release that will make all human actions inconsequential. Short answer: yes. It turns out there’s new information coming out all the time. For example:
- Arctic’s Melting Glaciers Reveal Hidden Methane Time Bomb
- Mapping methane emissions from rivers around globe reveals surprising sources
The third big question is what impact the current ENSO cycle will have on methane. And you guessed it. Warmer weather during El Niño helps create more equatorial fires, which creates more carbon monoxide, which cannibalizes hydroxyl radicals, which increases the atmospheric lifetime of methane, which increases the total amount of methane.
So, just a little bit of reading of practically any sensible article will show you that the peak growth of methane reached in 2021-2022 was an artifact of the moment. And it’s coming back.
So here’s my over/under.
Anthropogenic methane won’t slow down until global industrial civilization slows down. But then little things like the feedback loops from unattended fires and a huge decline in air travel could negate that slow down by lengthening methane’s lifetime. So that’s a wash.
Meanwhile we have more than enough natural methane bombs with their fuses lit, windows of opportunity welded shut, and canaries in the coal mine dead and buried. In other words, methane bombs will go off.
My over/under? There is none. It’s all “over” at this point.
I know why the media stopped its coverage of methane. It’s not sexy. It’s not bloody. It’s not funny. And it’s hopeless. Meanwhile, there are just too many other stories that sell better. From politics to wars to religion to social justice to celebrities to royals to sex scandals, the whole planet of the humans is pretty f&%ked up right now.
Thank you for your analysis, Eliot. Much appreciated!
i loved and got scared, many thanks
Something related to Brown Carbon? Been wondering if this is going to slow down CH4 breakdown.
Excellent article! Thanks, Elliot.
Great! Thanks! Moreover, as long as CH4 is accumulated, I think it’s the effect in year 1 (perhaps 200*CO2e) that is relevant. I believe using the 80-times-effect over 10 years in climate models (if accounting for methane at all) is one reason models have a hard time to keep up with reality and what should be expected from emperical records (ice cores etc). I think Hansens estimated upper-band of acceleration in temperature (0.36C/decade, Global warming in the pipeline) risk being more like the lower-band already in the early 2030s when it’s reasonable to assume we’re jumping towards the 2C-level with another El Nino, since we’re likely are establishing the +1,5-level of GAST compared to 1880-1900 during this and next year.
Jennifer and I did an update August 23…
https://www.youtube.com/live/4fO5lGsQ0PE?si=_oS0kPzYcvv-_FBR
Thanks for researching and writing this Eliot.
Eliot, thank you for tackling this subject. I have been wondering for some time why methane hasn’t been discussed in media, when I was certain it was a HUGE problem. This update was sorely needed and I thank you for doing the work. Sending love your way from the East Coast.
Thanks, yes — it seems to have completely disappeared from the conversation (for now).
Methane is lost to the atmosphere during oil & gas extraction. Near Greeley, Colorado, there was a huge flame “burning it off” that could be seen for miles…
I wonder what is your opinion about what R. Pierrehumbert recently wrote about atmospheric methane in Bulletin of the Atomic Scientists:
https://thebulletin.org/2023/12/mass-delusion-and-wishful-thinking-why-everything-you-think-you-know-about-methane-is-probably-wrong/ ?
I am not sure what I think I know, but mass delusion is certainly spot on with regard to any assumed fix for collapse.
Looking forward to the read.
Whenever I look at SSTA on earthnullschool I see anomalous cold water along the coastal continental shelf where it is MY understanding that you will find the majority of methane hydrates as they have a particular temp/pressure requirement. My understanding of methane would lead me to believe that the SSTA signature is from destabilized methane hydrates.
Am I seeing something that does not exist?
It’s even worse… lifespan can be up to 120 years:
https://en.wikipedia.org/wiki/Atmospheric_methane
Result of methane oxidation is water Vapor and CO2, both greenhouse gases of course.
And methane also degrades the ozone layer.
Maybe the ozone hole will NOT close…?