How Many Hiroshima Bombs per Second?
Okay, it happened again. Just this week, an article on mainstream media used the Hiroshima Bombs per Second (HpS) metaphor to describe how fast the planet is heating up. This time the conclusion was that the oceans are heating up at a rate of 5 HpS. And they got it Wrong! Wrong! Very wrong!
The calculation of HpS is straightforward and depends on a number called the Earth Energy Imbalance or EEI. This number is the difference between the totality of incoming solar radiation and outgoing radiation of all forms. The EEI is expressed in the units of Watts per square meter (W/m²). As Dr. James Hansen said on Twitter last December, “Earth’s energy imbalance is the best diagnostic of where climate is heading.”
In this article I computed HpS based on the EEI as published by NASA for the annualized 12 month period March 2021 to February 2022. My answer was 13.3 HpS globally. Given that about 90% of the EEI is captured by the oceans, this means about 12 HpS warming the oceans.
I’ve been eagerly awaiting an update to the NASA data. Just this week, thanks to some help by Leon Simmons, I was able to go to the CERES website and download the EEI data through August, 2022.
It turns out that the February 2022 number was a local maximum and things have been declining a bit since then. For the 12-month period September 2021 to August 2022, the EEI was 1.40 W/m², the equivalent of 11.4 HpS globally and 10.3 HpS into the oceans. Here is the full HpS record using a 12-month running mean:
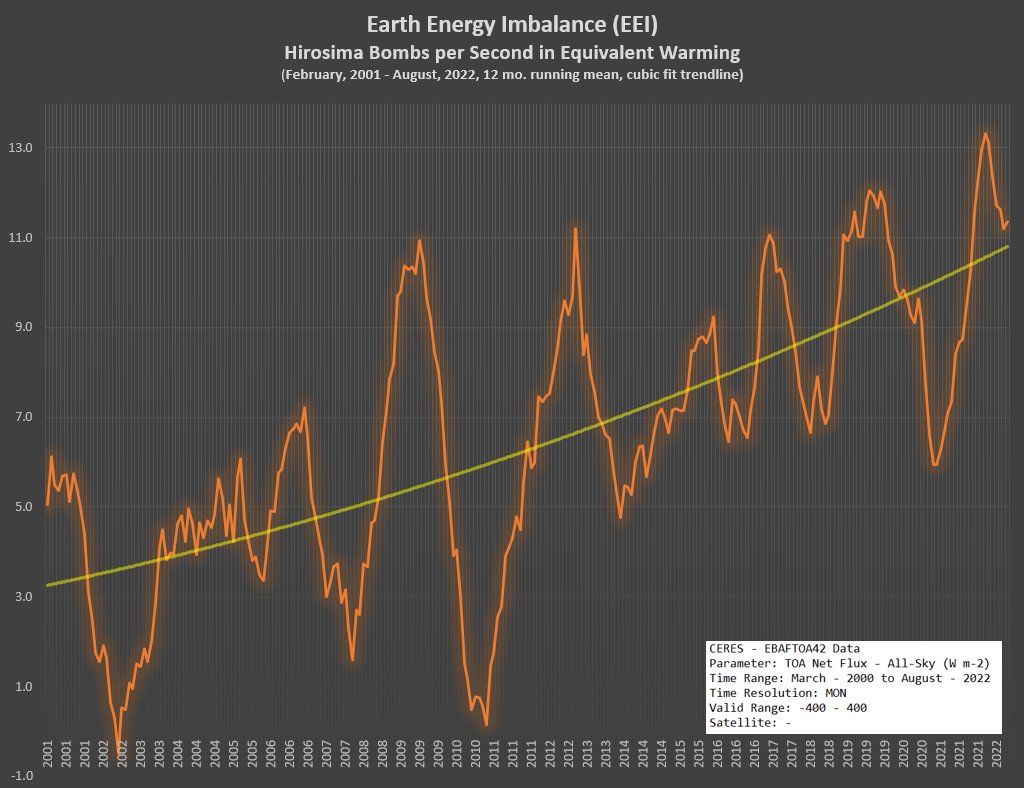
But this isn’t the end of the story. In this Tweet, Dr. Hansen presented a graph of the EEI that included the most recent data through August, 2022 (now updated through November, 2022). In it, Dr. Hansen references the September 2019 to August 2022 36-month running mean, showing it as 1.22 W/m².
There’s a good reason to take the long view. As you can see by the graph above, there is a lot of year-to-year variability in the EEI. This variability is caused by many factors, including ENSO and other climate cycles, the solar cycle, global cloud cover, volcanism and any number of anthropogenic influences including the recent Covid slowdown. Taking the long view allows us to smooth out this noise and get a better perspective on the long-term trend for the EEI.
Here is the graph of the 36-month running mean of the EEI expressed in HpS, together with a linear trendline:
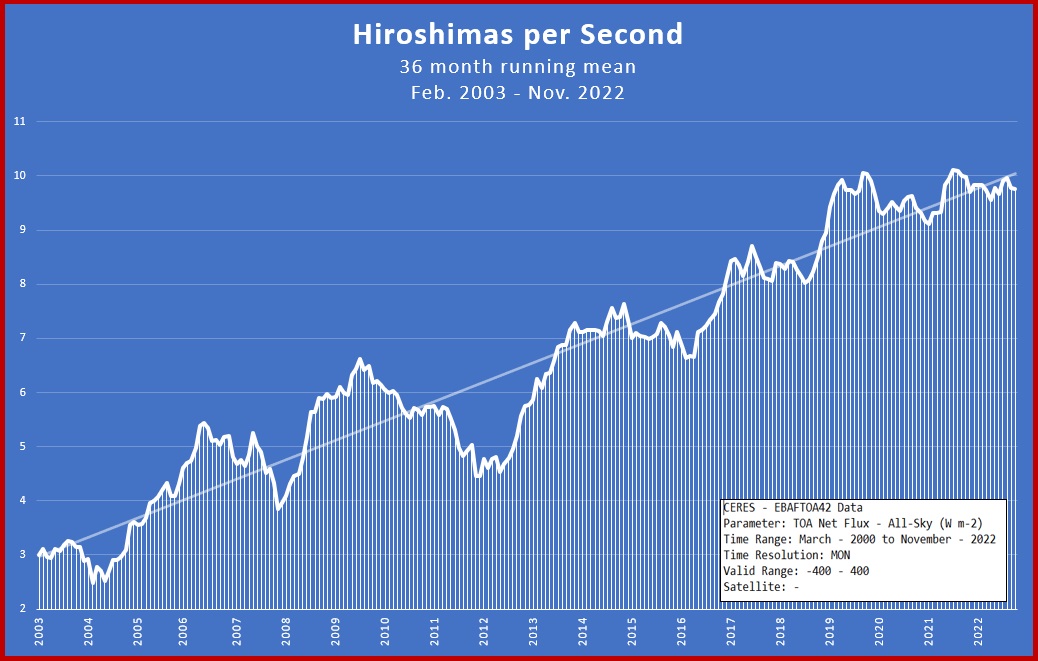
The August data point on this graph corresponds to Dr. Hansen’s 1.22 W/m², which is equivalent to 9.91 HpS globally or 8.9 HpS into the oceans. With reference to the CBSNews article, our sad planet passed the 5 HpS milestone a decade ago.
Looking deeper into this graph, it is just stunning to see that the EEI has risen from about 3 HpS back in 2003 to about 10 HpS today. The EEI has more than tripled in 20 years. That means triple the heat being captured by rising greenhouse gasses. Triple the heat melting the poles, heating the oceans, super-charging storms, baking our continents. Triple the rate of “warming” of our planet.
The next graphic tells how the EEI has changed over time by month, again using the CERES data.
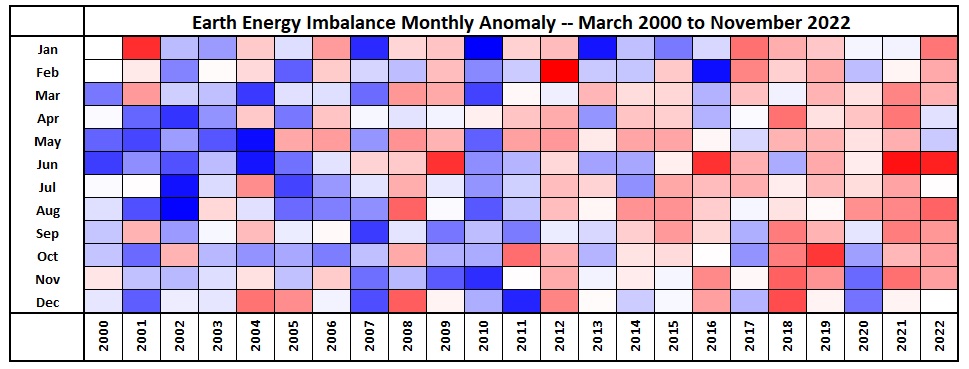
What I did here was to get the average EEI for each of the 12 months of the year, with the average taken from 2000 to 2022. I then looked at each month and computed the difference of the EEI for that month and the overall average EEI for the same month. I then colored the month, using a shade of blue if the month was below average and a shade of red if it was above average. The darker the shade, the greater the deviation from average.
You can easily see from this graphic that the tendency is towards red in all months. In other words, the EEI is growing year round. As the years pass, the planet is absorbing more and more heat. But some months are getting redder faster than others.
The following chart measures the change in HpS by month in a way that lets us determine which month is heating up fastest. Rather than measuring the overall average HpS for each month over the period 2000-2022, what I did was to compute two averages. The first was the average HpS for each month over the period 2000-2017 and the second was to compute the average HpS over the last 5 years, 2018-2022. I then measured how much HpS had increased each month between those two averages. This is what I got:
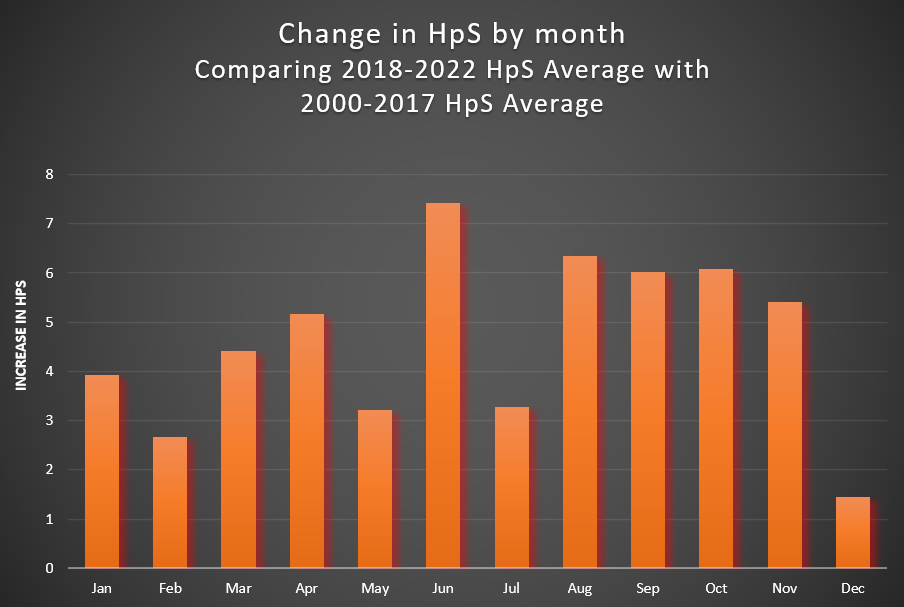
As you can see from this, the month of June is the clear leader. In fact, the number of HpS for June has increased by an average of 7.4 over the last 5 years, while December’s HpS has increased by only 1.4. In simple terms, June is heating up faster than any other month.
There is no other metric that truly underscores how fast the changes are happening on our planet. Not the Keeling curve or other monthly measurements of greenhouse gasses. Not the rapidly shrinking global ice. Not the rapid rise of the global mean temperature over the 1850-1900 IPCC baseline. Not the burn scars across Siberia and the Amazon. Not the loss of species and habitats. None of these shows what the Earth energy imbalance shows.
The metric of HpS is one that we humans understand. We all have seen pictures of atomic explosions. Their heat is immense. The damage that even one explosion can do to a city is devastating. And yet, here we are, lighting off 9.91 of these bombs every second, nearly 36,000 an hour, over 850,000 a day. Humans have “warmed” the planet by the equivalent of 935,000,000 (935 million) Hiroshima nuclear bombs over the last three years.
We can go even further. If we look at the average HpS over the last 20 years (the period September 2002 – August 2022), then it turns out that the long-term average is about 6.74 HpS globally and about 6.1 HpS into the oceans. At the very lowest end, this is the minimum number mainstream media should report. Anything less than reporting the oceans heating at a rate of 6 HpS (like the CBSNews article) is just hogwash innumerate reporting. And this value is averaged over 20 years, not the most recent value at all.
Adding the last 20 years all up, we get total warming due to the EEI over the last 20 years equivalent to lighting off 4,250,000,000 (4.25 billion) Hiroshima nuclear bombs, of which about 3.8 billion went into heating the oceans.
Our planet is on fire and the fire is getting hotter. We, together with all the living breathing species on our planet, are hurtling towards our collective oblivion. Be kind. Be generous. Be of service.
Great piece!!! Stay safe!!
And some are worried of a nuclear threat and winter, while been bombing ourselves all along!
Thanks for the correction and perspectives, Elliot
Thanks for this, but there is another metric to demonstrate the negative effects of the same population density stress that’s driving global warming and that’s our collapsing health: 55-60% of adult Americans have at least one serious chronic medical condition requiring ongoing medical attention, one in five (20%) of working adults (20-50yo) are dying from alcohol related diseases, our youth are ever more faced with the bleak future and suffering from the “diseases of despair” (Deatons), and all of this is accelerating parallel to the ocean warming (heating) graph. BTW, each and every human living today is producing 160 BTUs/hr from metabolism, so 160 X 24 X 365 X 8B. You do the math! And yet, we insist on following the advertising dictates of corporate America to travel in fossil fuel burning machines and the world burned 8B metric tons of coal last year, one for every man, woman, and child on the dying planet. Is this really the world we should be bringing another innocent life kicking and screaming into? Stress R Us
I’d say the difference is that HpS is a global metric — your metric referencing Americans would be more telling if it could be expressed globally. We know a lot about global hunger, poverty, disease and addiction. For example:
https://hungermap.wfp.org/
Everything is headed full speed in the wrong direction.
Thank you for the good work you do as an MD.
When i saw the CBS article in a thread i was furious, knowing that you’ve already proven it’s way way beyond that. Mainstream just can’t be trusted, at all
I accept the physics. We really are “lighting off 9.91 of these bombs every second, nearly 36,000 an hour, over 850,000 a day.”, but for lack of a recognizable equivalent I can’t get my head around how much energy that is on some familiar scale. And I suspect many reject the analogy to Hiroshima bombs per second out of hand because 800K of these explosions a day just seems incomprehensible. The heat is immense but how much heat, and what could that heat otherwise do in in the world? Would it translate into, say, total human energy consumption per day for X amount of time? Our total household electricity consumption per century?
One Hiroshima bomb is said to release 63,000,000,000,000 (trillion) joules of energy, a joule being a unit of heat. Holy crap! What can one joule do? What I found on Wikipedia for “practical examples” isn’t helping:
“The amount of electricity required to run a 1 W device for 1 s.
The energy required to accelerate a 1 kg mass at 1 m/s2 through a distance of 1 m.
The kinetic energy of a 2 kg mass travelling at 1 m/s, or a 1 kg mass travelling at 1.41 m/s.
The energy required to lift a medium-sized tomato up 1 metre (3 ft 3 in), assuming the tomato has a mass of 101.97 grams (3.597 oz). (!!!!!!!)
The heat required to raise the temperature of 0.239 g of water from 0 °C to 1 °C, or from 32 °F to 33.8 °F.”
[link removed by EJ]
So, if 1 joule lifts a medium-sized tomato up 1 metre, 63T joules will raise the tomato 63T metres or ~39B miles, roughly 14 times the distance from here to Neptune. No help there. More thought needed.
Hi Brian,
Thanks for giving some thought to other examples. At the end of this article, I give a few other comparisons to the current EEI,
https://climatecasino.net/2022/05/earth-is-heating-at-a-rate-of-1150000-hiroshima-bombs-every-day/
Kind regards
This is very interesting and many words beyond that. However I’m really puzzled by the discrepancy between 5 and 10+ HpS. I’m just going to take the math you have laid out and in other pieces as correct. So how did the authors arrive at 5? Were they using older data? Was the data normalized in someway not done in this article? Otherwise to assume the 24 people who put their names on https://link.springer.com/article/10.1007/s00376-023-2385-2 are flat wrong or liars seems to far a stretch. Michael Mann signed off on this report.
I am as equally puzzled as you at how the numbers 3, 4, 5 and so on have lingered so long, even as the number has crept up, hitting 13.33 HpS in February, 2022 (based on the 12-month running mean). Before I published, I had my work checked by two individuals, one of whom was the person who originally came up with the HpS metric way back when. A famous meteorologist I follow on Twitter would not accept my work, but instead went with a source that was based on 2012 data. I have no idea …
9.91 HpS is still the conservative conclusion though, right, that’s just the August maximum in 2022? You said at one point that the 12 month mean for Sept ’21 to Aug ’22 was over 11 HpS right?
HpS peaked at 13.3 HpS for the 12 months ending in February, 2022.
It does seem you observed it first publicly. The implications of this blog post are what is driving more global coverage:
https://www.theguardian.com/environment/2023/apr/26/accelerating-ocean-warming-earth-temperatures-climate-crisis
https://www.commondreams.org/news/ocean-warming-study
https://www.bbc.com/news/science-environment-65339934
A decade would be nice…, Santa Barbara…, well, I canèt say really…, give it a year…, maybe a month, who can tell with these things…, the Antarctice takes six years in average to wipe us off the face of the Earth…, so they say, digging cores in the mud, who could have guessed…, itès all in a days work, It should have taken its time, when you give it a thought…
Thanks for sharing. Worrisome, but how do we get some action.
While some parts of the world don’t bother letting coal stay in the ground others purchase products ever still from these areas… So no one acts.
“I’m Alright Jack”
==============
The human condition means that most people won’t change their
habits of a lifetime until such time that their experiential
circumstances are impacted or changed for the worse.
The trigger point for change is pain, and lots of it.
“Keeping up with the Joneses”
=========================
So long as “Simon and Samantha” are going on their thrice per year flights to Thailand, to enjoy
the sun and social scene, then “Timothy and Tammy” won’t want to feel left out either.
Same applies to the type of cars they have and in fact all other aspects of their respective
competing material demands.
We are all going to hell in a hand cart.
Some further social and/or political science comment here, as opposed to physical or climate science…
Here in Europe over the weekend, the Greeks have elected a new government. One could say this is hardly news. However, if one considers the recent track record of the new government and its associates, we can be forgiven for showing more concern for the election but it’s even more serious than just “politics”…
“The conservative leader [Mitsotakis] has formed a reputation as a Teflon-coated leader, fending off a series of damaging crises in the past year, including a rail disaster and a wire-tapping scandal that brought down the intelligence chief and his own nephew, who worked as the prime minister’s chief of staff (© BBC News – 26 June 23).
Moreover…
“Kasidiaris had been the spokesman for neo-Nazi party Golden Dawn, which was banned as a criminal organisation and its leaders given long prison terms.
Together with nationalist Greek Solution and ultra-conservative Niki (Victory), the three hard-right parties won close to 13% of the vote and 34 seats.” (© BBC News – 26 June 23).
And…
“He [Mitsotakis] also succeeded in attracting more young voters than his rival.” (© BBC News – 26 June 23).
“Since the migrant crisis, the views of most Greek voters have shifted in favour of stricter, more conservative policies … the reason is rooted in the 2020 migration crisis on the Evros [river], when Turkey tried to push thousands of migrants into Greek territory and the Mitsotakis government acted swiftly. So the greater part of the public perceives the migration issue as an external threat to national sovereignty, says Panos Koliastasis, assistant professor of politics at the University of Peloponnese” (© BBC News – 26 June 23).
And so there we have it, the population shifting to extremes in order to address their concerns about migrants. These are migrants who are escaping climate change impacts in their respective countries and in increasing numbers.
Italy and Greece, who have now voted for a fascist and a combination of hard right and other fascists, the hard right and fascists who have made much out of dealing with the influx of migrants onto the shores of Southern Europe.
This doesn’t bode well for the wider political environment around Europe, especially given recent history…
All of this of course is driven by climate change impacts and driving people from their lands, so that as migrants they travel North where there is at least water it little else.
This situation can only get worse and climate change impacts worsen. Supra-biblical carvans of migrants will cause Europe to have to face the music at some point but how this will come about and in what way, I have no idea.
And what is deeply depressing about all of this is that there is so little, if any reporting in MSM and the press, about the drivers behind these increasing waves of migrants.
I can’t speak for these types of population stressors else where in the world but it strikes me that the problems being encountered, and the way they’re being addressed in Europe especially, is deeply troubling.
And I would go so far as to say, this emerging trend of mass migration due to climate change is as bad as any equivalent Hiroshima bomb impact(s)…
Mmmmmm, my head is in a vice, squeezed flat. My heart quakes but the tears won’t flow. Good Lord what have we done? What are we doing? Why can’t we stop?
According to the Federation of American Scientists, there are a total of about 12,500 warheads in the world’s nuclear arsenals:
https://fas.org/initiative/status-world-nuclear-forces
That’s *all* the warheads, not just the deployed ones. *All* of them.
Let’s assume each warhead has a yield of 1 MT – that’s much too high but sufficient. That means there’s a total of ~12,500 MT on the planet.
Given the yield of ~15 kT for Hiroshima, that means there’s about 830,000 Hiroshimas in the world’s nuclear arsenal.
So, given anthropogenic climate change is dumping 1,150,000 Hiroshimas into the climate system every day, that means we’re waging 1.4 global thermonuclear wars on the planet *every* *single* *day*.
Someone check my math, please.
1.4 global thermonuclear wars every day seems impossible.
Forgot to mention the 1.4 global thermonuclear wars/day is too low – the actual yield per warhead global average is much less than 1 MT; probably 150 kT – 200 kT. So, that means we’re putting 7+ GTNW/day into the climate system.
Hi all! I have gone from the EEI of 13.3 HpS, thanks to Eliot, to 1.2 trillion tons of global ice melting (C3S), to 1 trillion tons of water vapor evaporating from the earth’s waters. Both the phase shift from ice to water (343 BTUs/gram) and then water to vapor (2,260 BTUs/gram) are “latent energy” storage shifts that may not be included in the EEI number. Am I correct? But, then, what about global equilibrium of the various energy sources in both “raw” form and latent forms. Doesn’t that mean that we’re generating roughly 3 X 13.3 HpS, but in both raw and latent forms in a constant state of equilibrium? So, 39.9 HpS? The current string of low pressure storms in the US, entering as low pressure energetic events from the Pacific, entering land in BC,CA, and then marching down to the lower midwest, until swinging back up to NE and maritime Canada, is another indicator of an increasing EEI, right? The big picture of EEI? Thank you, Eliot and Co.
Correction: I left out the original 13.3 HpS of heat in the atmosphere at any one time, so real total is 4 X 13.3 = 53.2 BpS, when latent sources are including with atmospheric heat. Of course, latent sources of heat capture are accumulating ever larger amounts of sequestered heat. God help us!