April 8 quote by Naomi Klein does it for me. .. bit by bit, hour by hour, day by day,…
Is the Methane Catastrophe Happening Right Now?
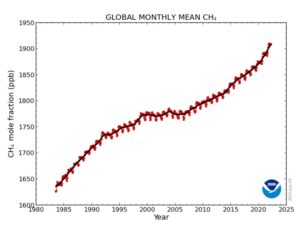
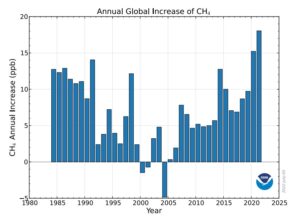
Methane (CH₄) has been in the news a lot lately, mostly because the monthly numbers released by NOAA continue to skyrocket into record territory, while simultaneously increasing year-over-year by record amounts. Methane currently stands at a near-record 1909.2 parts per billion (ppb) while having gone up by 20.4 ppb in just the last year.
Methane is important for two major reasons. First, as a greenhouse gas, methane is more than 80 times as powerful as CO₂ over its first 20 years in the atmosphere. Second, mitigating methane in the short-run while technologies are developed to deal with CO₂ over the long-run is the basis for the recent COP-26 Glasgow Climate Pact. That 1.5°C target relies on a massive reduction in global anthropogenic methane over the next decade.
These two graphs tell the story of methane’s incredible rise in its rawest unanalyzed form (click on the images to enlarge):
 |
 |
Before you read on, let me give a strong caveat. I am not an atmospheric scientist. There is a lot I don’t know about what I am going to share below. Okay, I took a couple years of chemistry as an undergraduate and was a chemistry major until switching to math in my junior year. I’ve been refreshing my knowledge of some basic chemistry but certainly I have rough edges. I am acting as a science journalist and not an atmospheric scientist in my writing capacity for this article.
Back to methane. Many countries internationally are trying to get a handle on their methane emissions, with meaningful efforts at mitigating their anthropogenic sources. The COP-26 goal of “reducing anthropogenic methane by 30% by the year 2030” may never happen, but at the very least given the tangible efforts going on right now, we shouldn’t expect methane to still be rising, and certainly not at the record pace demonstrated by the NOAA graphs. Of course, landfills, farming, fracking, cattle, mining and other sources continue to spew, but they aren’t expanding their operations in any fashion that is even close to explaining the rise.
So where is this methane coming from? There are some who think that the East Siberian Arctic Sea (ESAS) methane hydrates are starting to thaw or the methane released from Siberia and other permafrost sources might be the reason. There is certainly a simple feedback loop going on here: methane heats the atmosphere causing release from these sources which in turn heats the atmosphere. But isotope studies show that ESAS and Siberian methane are not yet significant sources. It may happen that over the next few decades the so-called “methane bomb” lets loose. When that happens, this planet will go through some quick changes. But we aren’t there yet.
There are also termites. Long-term predictions show that as the planet warms and more CO₂ enters the atmosphere, there will be more plant growth (where conditions allow), which will provide more food for termites, which means more termite-sourced methane over the long-run (centuries). Right now termites are responsible for about 12% of natural emissions, but there is no evidence that this number has risen in any meaningful way over the last few years.
The largest natural source of methane is anaerobic wetland decomposition, accounting for about 75% of natural emissions. During La Niña years there is more rainfall in equatorial regions, causing more decomposition which in turn releases more methane. An extremely powerful La Niña has been ongoing since July, 2020. Of course, if La Niña was the sole reason, we should see the signature of methane rise in other La Niña periods. A strong enough correlation to explain the recent rise is simply not there.
There is another more recent explanation that ties to wetlands. Climate change also drives more rainfall, as a warmer atmosphere holds more water vapor. Each 1°C in global temperature rise corresponds to about a 7% rise in the ability of the atmosphere to hold water vapor. Again, more rain means more anaerobic wetland decomposition. There is strong evidence that certain East African wetlands have been prolific in their recent methane releases, for example this article from just two weeks ago: “In ominous sign for global warming, feedback loop may be accelerating methane emissions.”
Here is a quote from the article:
Atmospheric methane levels have risen nearly 7% since 2006, and the past 2 years saw the biggest jumps yet, even though the pandemic slowed oil and gas production, presumably reducing methane leaks. Now, researchers are homing in on the source of the mysterious surge. Two new preprints trace it to microbes in tropical wetlands. Ominously, climate change itself might be fueling the trend by driving increased rain over the regions.
What else? What other source could there be? Well, that’s the problem, there just aren’t any. As a consequence, looking at the rise in methane from its sources may be entirely the wrong perspective. This is difficult for some to understand. I have repeatedly experienced resistance from those holding on to their belief in a particular source being the cause, even when I explain that there simply isn’t enough methane emitted by their source to account for the recent meteoric rise. If not sources, what?
In art, negative space is defined to be the area around the subject, it is the definition of something tangible by bringing attention to what’s not there. It turns out that the negative space to “sources” may help us understand the methane spike. So-called “sinks” are the chemical and biological processes that scrub methane from the atmosphere, that make it go away.
The half-life of methane (the period of time it takes for half of the methane in the atmosphere to naturally decay away) has been generally assumed to be static, somewhere in the range of 110 months (just over 9 years). That is, if 100 methane molecules are released into the atmosphere today, then 110 months from now, 50 of them will be left. In another 110 months, 25 will be left, and so on. While there is some disagreement on the exact half-life, most climate models assume this number changes very little over time.
But what if the half-life of methane is increasing? What if over time methane is now lasting longer in the atmosphere? What if the static processes are not static after all, but themselves degrading due to feedback loops and direct human f&%kery, allowing existing methane to persist?
To address this possibility, we have to understand what makes most of those methane molecules go away. It turns out that the primary sink for methane is a reaction with the highly reactive and very short-lived hydroxyl radical, OH*. I’m not going to go into the atmospheric chemistry, click here for a good explanation. Suffice it to say that OH* requires sunlight, ozone and water vapor, conditions that are available in abundance in equatorial regions, exactly where those wetlands are producing methane. Once created, OH* looks for something to react with, and typically finds it within about a nanosecond (1 billionth of a second). About 90% of all methane is removed from the atmosphere by a reaction with a hydroxyl radical.
So here’s the latest news. There are other chemicals entering the atmosphere that are preferentially reacting with hydroxyl radicals, using them up before they have a chance to react with methane. The main culprit is carbon monoxide (CO), which is about 40 times as reactive with hydroxyl radicals as methane, giving CO a half-life of about 3 months. If there were suddenly a new source of CO in regions of the planet where methane is spewing, then the hydroxyl is going to preferentially react with the CO, leaving the methane there, not scrubbed from the atmosphere as would normally happen. In other words, the more atmospheric CO there is, the longer methane’s half-life.
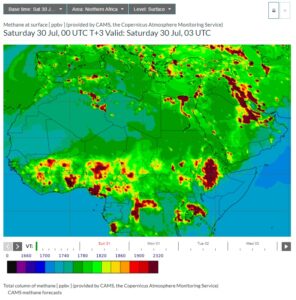
Here are side-by-side pictures from CAMS of Northern African methane and carbon monoxide taken from today’s forecasts (click on the images to enlarge):
 |
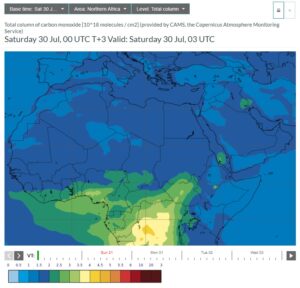 |
You can readily see the massive amounts of both methane and carbon monoxide in the equatorial regions of Africa. So where is the carbon monoxide coming from? It turns out from wildfires and waste fires, and there’s plenty of both.
Here’s the feedback loop: global warming is driving wildfires, those fires are releasing carbon monoxide into the atmosphere, that carbon monoxide is cannibalizing the hydroxyl radicals that would normally oxidize methane, the methane in the atmosphere is lasting longer than before, longer lasting methane means a spike in global methane exactly as NOAA is reporting, and finally, the spike in methane is increasing the heating of the planet, driving more global warming.
This is not just my idle fantasy. This feedback loop was featured in an article published just a few weeks back in The Guardian, “Methane much more sensitive to global heating than previously thought — study.” From the article:
The hydroxyl radical has been termed the ‘detergent’ of the atmosphere because it works to cleanse the atmosphere of harmful trace gases,” said Redfern. But hydroxyl radicals also react with carbon monoxide, and an increase in wildfires may have pumped more carbon monoxide into the atmosphere and altered the chemical balance. “On average, a carbon monoxide molecule remains in the atmosphere for about three months before it’s attacked by a hydroxyl radical, while methane persists for about a decade. So wildfires have a swift impact on using up the hydroxyl ‘detergent’ and reduce the methane removal,” said Redfern.
But wait, there’s more, just consider the hydrogen revolution — using hydrogen gas (H₂) as a replacement energy source for fossil fuels. It turns out that leaked H₂ also cannibalizes hydroxyl radicals, with H₂ having a half-life of about 2 years. Hydroxyl radicals will preferentially react with H₂ over methane. Because H₂ is such a small molecule, it can easily escape the existing legacy infrastructure that is being converted to produce H₂ as a replacement energy source. This article came out just a few days ago: “Warming impacts of hydrogen emissions are overlooked, underestimated: EDF.” From the article:
In the troposphere, less OH is available to react with methane; given that methane’s reaction with OH is its primary sink, this leads to a longer atmospheric lifetime for methane, which accounts for around half of hydrogen’s total indirect warming effect …
And now we are finding out that the decrease in aviation and travel during the COVID lockdowns also played a role in depleting hydroxyl, as described in this article, Travel emissions drop aided lockdown methane surge.
More than half of the 50 per cent jump in methane’s growth rate between 2019 and 2020 was the result of reduced emissions from road transport, railways and planes during lockdowns, the study found. Reduced transport emissions led to lower levels of another gas – called the hydroxyl radical – that acts like a detergent to remove methane from the atmosphere, researchers say.
Here is the research paper on which the article above was based: COVID-19 lockdown emission reductions have the potential to explain over half of the coincident increase in global atmospheric methane.
And a quote from the abstract of the research paper cited above:
Compared with 2019, measurements of the global growth rate of background (marine air) atmospheric methane rose by 5.3 ppb yr−1 in 2020, reaching 15.0 ppb yr−1. Global atmospheric chemistry models have previously shown that reductions in nitrogen oxide (NOx) emissions reduce levels of the hydroxyl radical (OH) and lengthen the methane lifetime.
And in case that isn’t enough, in 2020 there were new regulations put in place for the fuels used by the transoceanic shipping industry. These regulations have resulted in far less sulfur dioxide and other sulfur compounds being released into the atmosphere. The results from this include the possibility of hydroxyl cannibalization through chemistry I don’t fully understand involving what’s known as DMS and changes in oceanic low-level clouds. See this Tweet by climate researcher Leon Simons.
And here’s yet another mechanism that could lead to the half-life of methane increasing, this time having nothing to do with hydroxyl radicals. Namely, the loss of the forest sink, as discussed in this 2018 article posted to phys.org. From the article:
“Over an 18-year period, methane uptake by urban forests in Baltimore declined by 62%; methane uptake by rural forests declined by 53%. At Hubbard Brook, over a 14-year period, methane uptake by forest soils fell by 74-89%.”
And finally, the sixth possibility is that the current level of methane is enough by itself to overwhelm the existing availability of hydroxyl radicals. One of the two, methane or hydroxyl, will be the limiting reagent. If enough methane has entered the atmosphere through natural and anthropogenic sources, there is a very real possibility that methane has simply now overwhelmed the available hydroxyl. As Leon Simons said in this Tweet, “Saturation of the hydroxyl sink is the worst case scenario.”
In some possible futures, there is yet another way that the half-life of methane could increase. The idea behind solar radiation management or SRM is that through geoengineering humanity may be able to cool the planet, or at the very least, keep it from warming quite as fast, allowing some future technology to return humanity from the brink. One of the main SRM ideas is to inject sulfate aerosols into the stratosphere above the Arctic and Antarctic. A plan to decrease the Arctic temperatures by 2°C involves about 175,000 flights a year, spraying these sulfates out the back of military air-to-air refueling tankers, as detailed in this article. One problem with this SRM plan, among many, is that this technology could potentially increase the half-life of methane by up to 16% as detailed in this article from 2017:
What they found (using models) is that sulfate aerosol injection would have several effects – on planetary albedo, on UV scattering and on circulation of air and sulfate particles between layers of the atmosphere. The two models used by the researchers suggest that those impacts, taken together these would result in an increased longevity of methane by as much as 16% – which would mean 16%more methane in the atmosphere at any one time. This would greatly exacerbate (“force”) warming.
Methane is increasing at record rates, but this may not be due to more methane being spewed than ever before. What appears to be the case from these recent articles is that it’s not the sources that are driving this rise, it’s the degraded hydroxyl radical sink and loss of other natural sinks.
To help visualize this, let me go back to some work I’ve previously done. I’ve been preparing graphs for about a year now, with an update each month, under the assumption that the half-life of methane is a static 110 months. These graphs have been showing the amount of new methane entering the atmosphere, taking into account that a certain fixed percentage is scrubbed each month. You can read about my my methodology in this article. I also have a video explanation you can find under the YouTube video tab above.
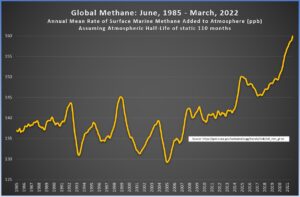
What I did that’s new was to use that same methodology, only I decided to look at what would happen in these graphs if the half-life of methane started to spike upwards just about the same time that the huge recent rise began. What if the cumulative impact of wildfires, waste fires, hydrogen leakage and cleaner shipping fuels have increased the half-life of methane from 110 months to 120 months over the last 40 months? What would that do to the graph showing the new methane entering the atmosphere?
Here are the two graphs, side by side. The left-hand graph shows the amount of new methane under the assumption of a static half-life of 110 months. The right-hand graph shows the amount of new methane under the assumption that the half-life increased from 110 months to 120 months over the previous 40 months (click on the images to enlarge).
 |
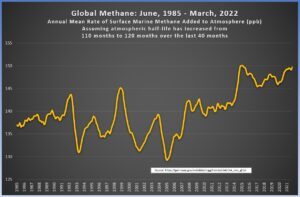 |
To me, the right-hand image seems quite reasonable. It shows relatively stable methane emissions over the last few years, which takes into account all the good work we humans have been doing to mitigate anthropogenic methane. With the assumption that the half-life of methane is steadily increasing, we easily solve the issue of the recent spike, and the results fall in line with what our intuition says they should be.
There’s only one problem, and it’s a huge one. No measurements for the half-life of methane are going on (that I know about). I have searched the literature and even asked climate-twitter, and there’s nothing on this topic. What we urgently need is a graph where the y-axis is the half-life of methane and the x-axis is time. We need to be measuring the change in methane’s half-life over time. This has got to be the most fundamental question on methane that apparently no one is working on right now. The longer methane persists in the atmosphere, the more f&%ked we are in the near-term.
If the half-life of methane is increasing through non-anthropogenic feedback loops, then the methane catastrophe is happening now, today, and there is absolutely nothing we can do to stop it.
Great article. Answers many questions that have been rattling around in my noggin.
In spite of having gotten a Gilbert Chemistry Lab for Christmas when I was 12, this is a demanding read for me. This is a simple video explainer I found on hydroxyl radicals, indicating their formation caused by sunlight reacting water molecules. It may be too simple as ozone is not mentioned.
[https://www.youtube.com/watch?v=ANqTEsQ4Q14]
I understand your conclusion that CH4 half life needs study, though I don’t exactly ken why you chose the the 110 month to 120 month comparison using marine surface CH4 emissions. Arbitrary choice to illustrate the concept I assume. Now that I know that OH could reduce atmospheric CH4 if there were enough of it to overcome it’s diminishment by prevalent other gasses… is there any process we could deploy that would increase OH concentration? But atmospheric chemists would have already asked that question and let us know of anything useful.
Thanks for getting me closer to understanding whats going on with CH4.
Sorry, it is not as easy as I would like to make it, but sometimes the answer is not easy.
Not a problem, I’m not looking for easy answers.
You seem to have emitted the enormous methane emissions from animal livestock.
“There are an estimated 1.5 billion cows on the planet, and each one is capable of producing 500 liters of methane per day.”
In NZ where I’m riding out the apocalypse here are the stats; “In New Zealand, a country that relies heavily on agriculture, about half of greenhouse emissions come from this sector. Methane produced by livestock makes up 36% of New Zealand’s total emissions.”
“According to the United Nations, livestock is responsible for 14.5% of all greenhouse gas emissions from human activity.”
The devil is as always in the detail
No, I haven’t omitted anything. It seems you trying to tell me that somehow cattle have multiplied since 2018 and their new methane emissions have spiked enough to account for the rise in the last 4 years, while cattle did not account for that same rise for the decade before. To me, that makes no sense. Likewise those who think fracking or leaking wells are to blame. These things have been there for a long time, they didn’t suddenly appear in 2018 to make methane spike. Everyone knows about cows.
But a deep thank you for your reply, I added some language to the post to explain my position here. Please understand, we are talking about an unexplained rise. Give climate scientists a break. Ordinary variables like cattle, rice farming, fracking and leaks are well understood in the modelling. What’s new and horrifying is hydroxyl radical degradation.
Thank you EJ for the work you do to raise awareness of our predicament as species!
Thanks!
Thanks for this Prof.
I’m not sure that I could explain this to anyone else, but you always manage to write so that even a lay person can understand enough to get the gist. And the gist is, as usual, wholly terrifying.
Thank you!
As always, your blogs are very informative.
I’m pretty sure a recent tweet linked to a pdf that you said was good – but it seems to have disappeared. Could you re-share on this page?
It appears that, in addition to pushing more CO into the atmosphere, the significant increase of wildfires may actually alter the El Nino cycle.
https://theconversation.com/new-research-reveals-that-wildfires-can-influence-el-nino-187306
Please, please give a standard white background, black print foreground. I could barely read this with much effort and will probably pass on it in the future.
Given that it is a standard white background with a black print foreground, I think it is just best that you not read my blog.
That’s a pity about hydrogen. A hydrogen economy was looking like a suitable goal even with the leakage problem. Japan and UK are both teeing up to create a hydrogen economy. Seems like this methane increase may thwart them, though they probably won’t bother to check. Would a reduction in hydrogen leakage with improved pipework and infrastructure help? Even if it would can it be created soon enough?
Secondly, a major squadron of water-carrying aircraft needs to be stationed in each of the states and countries most prone to wildfires. Watching TV reports showing the pathetic amounts of water being dropped on these fires as they rage is disheartening. Or will H20 combining with CO create further problems in the atmosphere?
>>> Would a reduction in hydrogen leakage with improved pipework and infrastructure help? Even if it would can it be created soon enough?
Anything would help, but it appears that mostly existing infrastructure is being retro-fitted. And by “help” I mean levels of doom that perhaps drive fewer species to extinction.
>>>Or will H20 combining with CO create further problems in the atmosphere?
I am not an expert on atmospheric chemistry, so I don’t know about CO + H₂O. But my guess is that there are not enough water-carrying aircraft on the planet (or political will) to deal with the equatorial fires across South American and Africa that are driving CO production.
Just a thank you for your articles and twitter posts. Just a note: it should be mentioned what is called “methane half-life”… How is it defined? How is it experimentally evaluated? And I think there is some confusion between “methane half-life” and “methane lifetime”, though they must have strongly correlated values (if not proportional to the first order). I found gas lifetime is defined as Stock over depletion rate. Hmm, and half-life implies an exponential decay…
ah! just found this https://climateer.substack.com/p/methane-lifetime
anyway, it is lengthening and it is worrisome
Saluts du Québec!
Yes, I’ve started using “lifetime” instead of “half-life” just recently. But if the average time is 9.1 years, not every molecule lasts exactly 9.1 years, so what exactly is the distribution? Is it exponential decay with 9.1 years the average?
Thanks a lot (kind of) for the link, that just made it much harder. And yes, regardless, the lifetime is increasing and apparently at least a few others think that may be contributing to the recent spike.