April 8 quote by Naomi Klein does it for me. .. bit by bit, hour by hour, day by day,…

Betting on the End of the World: 2025 Edition
So, you’re at the water cooler hanging out with your work colleague, and the topic of global warming comes up. The two of you are getting an urge to make a friendly bet with each other, but you can’t decide what to bet on.
Betting on the end of the world means placing an Over/Under bet on some statistic having to do with the collapse of the climate. In other words, making a date-certain wager that some number will be over or under some specified target when the day comes. The actual Over/Under number given for the statistic represents a 50/50 chance for that target to be exceeded by the specified date. The statistic may be Arctic sea-ice extent or sea-surface temperature or CO2 or global population or something else.
Betting on the end of the world means making a wager with the understanding that everything is going to f&%k and the wager will keep you engaged in paying attention to how f&%ked that particular thing is getting.
This post has to do with betting on the long-term global 2-meter surface temperature anomaly and how far above the 1850-1900 IPCC pre-industrial baseline the temperature will get in the next few years. The wager is inspired by the Paris Agreement and the too often cited goal of staying under 1.5°C. I will be giving Over/Under temperature targets for friendly wagers you might make with your colleague. I previously discussed the methodology for computing these Over/Under temperature targets in This Post and This Post.
Remarkably, the Paris Agreement did not specify how to compute the current long-term global 2-meter surface temperature. What? You mean it’s not the 20-year or 30-year or trendline or model prediction? No. The Paris limit of 1.5°C is NOT DEFINED. No agreed upon methodology exists to compute the current state of global warming with respect to the pre-industrial baseline. I discussed this failure in detail in a recent MEER Talk I gave, back on December 1, 2024:
Anyway, if you read the background information or watch the video posted above, you will learn that the proposed way of computing the current long-term temperature I use is to take the actual temperatures from the past 10 years together with the model-predicted temperatures for the next 10 years, and to use those 20 years worth of data to compute today’s long-term temperature. So, 10 years of actual data, 10 years of predicted future data, the average gives the Over/Under for the wager. This method was first proposed by Richard Betts. You can read more about it here.
This way of computing the long-term temperature is a good compromise — it is not overweighted by past results and takes into account future warming. Today’s temperature is the average of 20 years — past AND future, with the prediction at the center. The only question is how to go about predicting future temperatures. That’s where models come in.
The method I use to model future global surface temperatures is quite simple, based on “decadal differences.” I simply subtract from each day’s global surface temperature the temperature from exactly a decade earlier and plot that point. I do this for every day from January 1, 1975 to December 31, 2024. I start in 1975 because that’s when the “great acceleration” more or less began, and I want to capture the current trend rather than be biased by the slower rate of warming from earlier decades. I then use a linear trendline for the decadal differences to forecast forward in time.

The trendline shows that the current rate of warming as of January 1, 2025 is about 0.32°C per decade, but that rate is rising with time, reaching 0.35°C per decade by the early 2030’s and going up from there.
Accelerating Warming
The fact that this trendline is increasing means that the decadal rate of warming is increasing, in other words, global warming is accelerating! Saying that temperatures are accelerating is the same as saying the current rate of long-term growth of global surface temperatures is quadratic, or that the 2nd-derivative is positive, or that the shape in general is “concave up.” But please, do not mistake a graph that is concave up as being the same as exponential growth. Temperatures are NOT increasing exponentially.
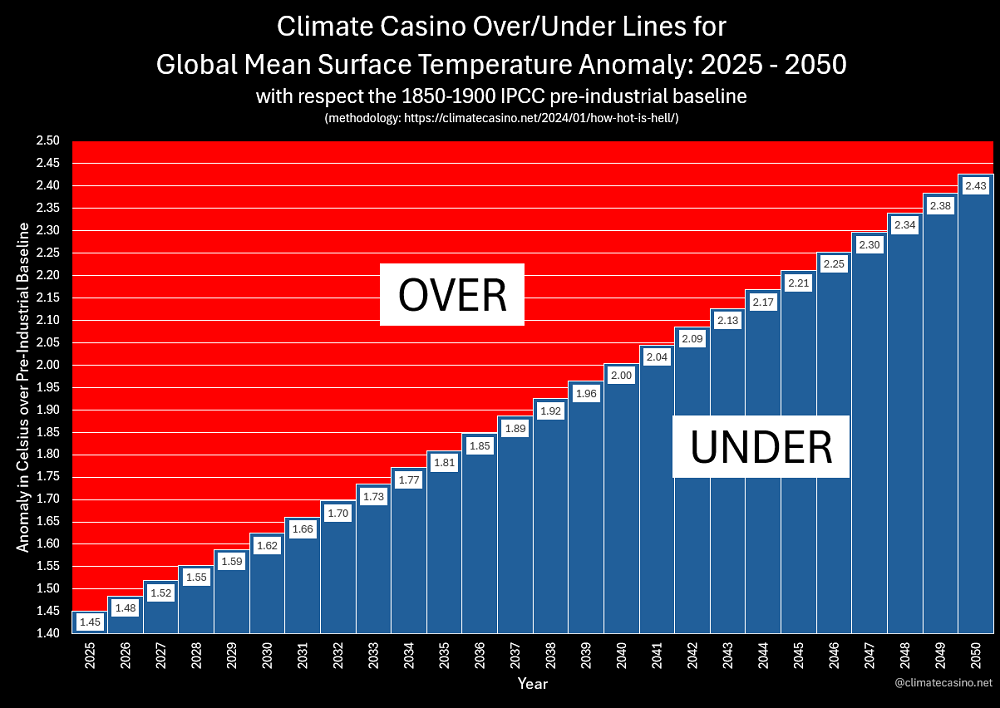
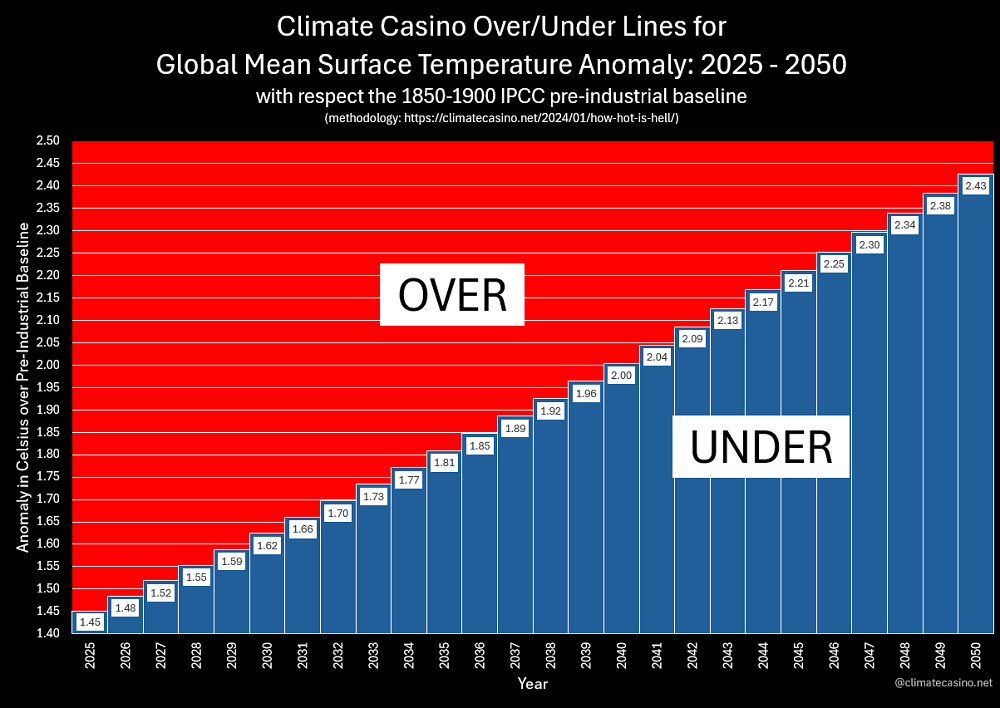
Next, using the exact equation for this linear trendline, I was able to forecast forward in time through the year 2050. Here are my Over/Under numbers for the global 2-meter surface temperature anomaly through 2050:

If you look closely, you will see that these numbers are slightly higher and faster than my previous Over/Under predictions made just last June in this post. In particular,
- The Over/Under for 2025 is 1.45°C.
- The Over/Under for breaking 1.5°C is 2027.
- The Over/Under for breaking 2.0°C is 2040.
In general the way to read this table is that it gives you guidance for setting lines for Over/Under wagers on the 2-meter global surface temperature anomaly for future years. For example, if you want to bet on the temperature in 2026 (which will come out in early 2027), you would take either the Over or the Under on 1.48°C, with a 50/50 chance that the final result will land on either side. If you want to wager on which year will be the first to break 2.0°C, you would take the Over or the Under on 2040, with a 50/50 chance the year will be before or after that date.
Make your bets!
Temperature Jerk
Now for a moment of speculation.
What I noticed in looking at the graph of decadal differences is that there is a slightly better fit possible by using a quadratic (degree 2) trendline for that data. To be more precise, the number R² gives a way to measure how good of a fit a given trendline is to the data. For the linear trendline (see the image above) we had R² = 0.0579. However for a quadratic trendline, we get R² = 0.0726. This means that a quadratic trendline is a considerably better fit.

The implication of using a quadratic trendline to fit the decadal differences is profound. What this means is that the 3rd derivative of the global surface temperature data is positive, or that global temperatures are going beyond just accelerating into what is known as “jerk.”
If acceleration is constant, we physically experience that as gravity — a constant force holding us against a surface. When acceleration is increasing, the physical experience is that gravity is increasing, the force is becoming greater. Picture being on a jet when the engines throttle-up — you are pushed back into your seat with an increasing pressure over a short time. That’s jerk!
Here is the Wikipedia page on jerk, in case you want to read more about it.
So, the global surface temperatures appear to be experiencing short-term jerk. There are many possible causes for this. The jerk may be due to changes in shipping fuel regulations, loss of cloud-cover and albedo, the short-term impacts of the recent El Nino, a mis-calculation of the ECS (equilibrium climate sensitivity) or something else. The cause of this jerk is for someone else to determine.
What we cannot do is to say that this jerk will continue on for very long with any great certainty. So, rather than extrapolate out to 2050, as I did with some confidence for the linear trendline, it is prudent to assume that this jerk will be short-lived. Even extrapolating out to 2040 may be dubious.
Nevertheless, for those who wonder what this jerk implies for Over/Under wagers with your colleagues, here are the Over/Under lines assuming that the ‘jerk’ continues for the next 15 years:

In particular, assuming ‘jerk’ continues:
- The Over/Under for 2025 is 1.51°C. (Yikes!)
- The Over/Under for breaking 2.0°C is 2035.
Similar to the linear trendline model, you could use this table to make future wagers. For example, you could bet the Over/Under 1.56°C in 2026, or you could bet total global climate f&%kery and doom by 2040. You know, that kind of thing.
Anyway, jerk could end at any time, so be cautious in making wagers using this data. You wouldn’t want to lose, would you?
Let’s see. James Hansen back in ~April 2024 thought that the global surface air temp would decline from the “gobsmackingly bananas” levels of late 2023-2024. That basically didn’t happen, and now early in Jan 2025 we are starting >1.7°C. After declining for most of 2024, the average sea surface temp for 60°S to 60°N are shooting up from the mid Dec. 2024 lows, let’s see if this trend continues. You have stated quite clearly that our warming curve is quadratic. The North Atlantic sea surface temperature is off the charts, and if Leon Simons et al. are correct, this will only get worse as the next stage of sulfur reduction in shipping fuel goes into effect this spring. So lose? Yeah, I’m lost. But still enjoying life. Anyway, we saw an enormous possum gorging himself on our bird seed last night in our backyard!
Hello Eliot, perhaps this is the source of the jerk, and it appears that it will continue to “Jerk” worse as Arctic temps continue to rise:
https://www.nature.com/articles/s41561-024-01614-y#Sec6
Substantial and overlooked greenhouse gas emissions from deep Arctic lake sediment | Nature Geoscience
Published January 3, 2025 Open Access
Abstract
Thermokarst lakes cause abrupt and sustained permafrost degradation and have the potential to release large quantities of ancient carbon to the atmosphere. Despite concerns about how lakes will affect the permafrost carbon feedback, the magnitude of carbon dioxide and methane emissions from deep permafrost soils remains poorly understood. Here we incubated a very deep sediment core (20 m) to constrain the potential productivity of thawed Yedoma and underlying Quaternary sand and gravel deposits. Through radiocarbon dating, sediment incubations and sediment facies classifications, we show that extensive permafrost thaw can occur beneath lakes on timescales of decades to centuries. Although it has been assumed that shallow, aerobic carbon dioxide production will dominate the climate impact of permafrost thaw, we found that anaerobic carbon dioxide and methane production from deep sediments was commensurate with aerobic production on a per gram carbon basis, and had double the global warming potential at warmer temperatures. Carbon release from deep Arctic sediments may thus have a more substantial impact on a changing climate than currently anticipated. These environments are presently overlooked in estimates of the permafrost carbon feedback.
————————————-
Bob Shaw Are Humans Smarter than Yeast?