April 8 quote by Naomi Klein does it for me. .. bit by bit, hour by hour, day by day,…
WTF is Happening? An Overview
As of June 10, 2023, worldwide data showed the remarkable concurrence of three dramatic climate events.
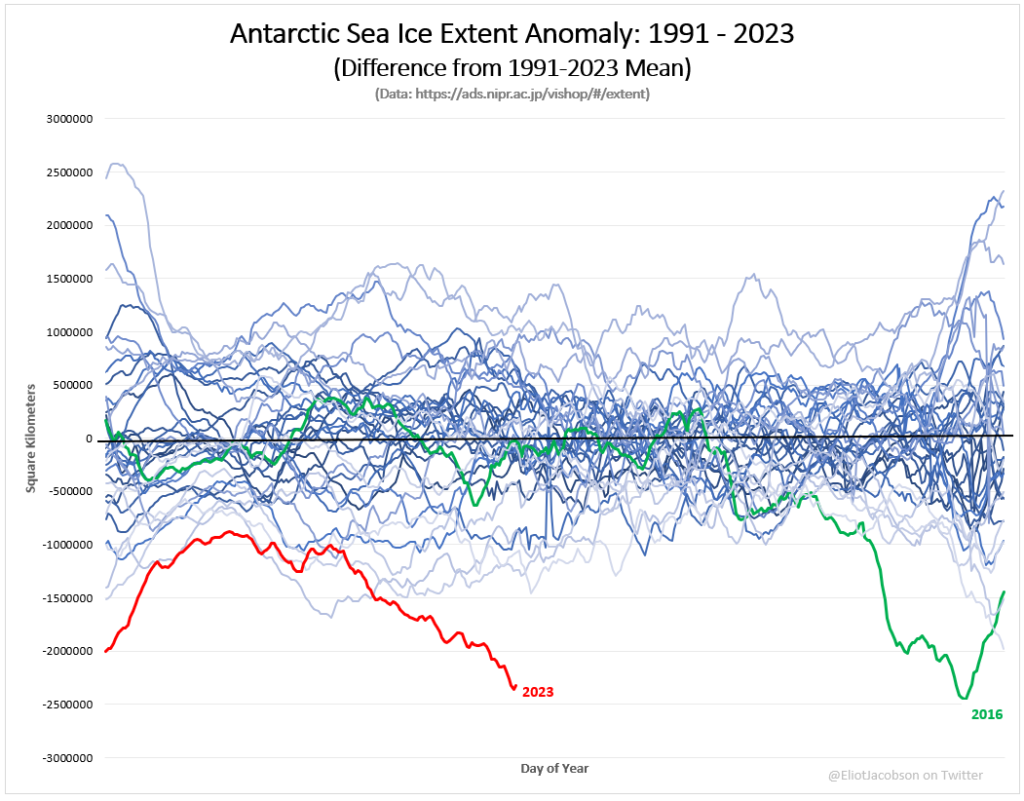
The first WTF is in the Antarctic, where sea-ice extent is setting record lows daily, now fully over 2 million kilometers below the 1991-2020 mean. This is not some one-off event. A decline like this has long been predicted. The impact is that there is a lot more open ocean than normal for this time of year. Open ocean means the ability to absorb incoming solar radiation, and that means further heating in a well-known feedback loop.
Using JAXA data, I prepared an image to illustrate just how crazy this moment is. The way you read the image below is that each horizontal blue wavy line is a year’s worth of measured sea-ice extent. Starting with the average extent over the period 1991-2020, I simply compare each day’s extent with that average and plot that point on the year’s blue line. The years shown in this image are 1991-2023, with 2023 in red to highlight just how unusual it is. For those of you with keen eyes, the dip at the lower right corresponds to the year 2016, the year after that last El Niño, and a harbinger of what may lie ahead.
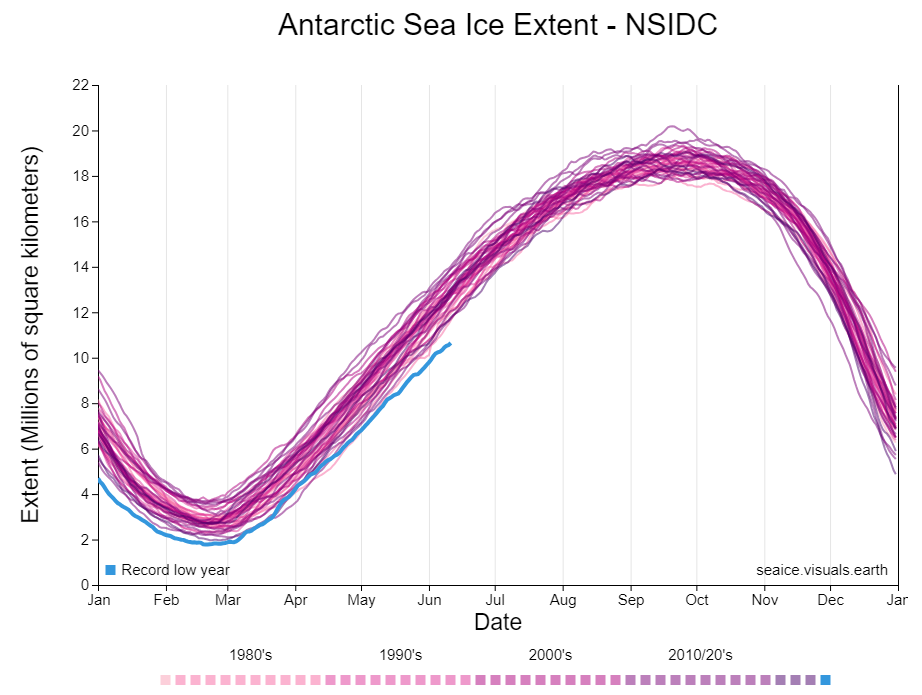
Below is a picture courtesy of Kevin Pluck using NSISC data that shows daily Antarctic sea ice extent. 2023 is represented by the blue line that’s well below the rest of the data.
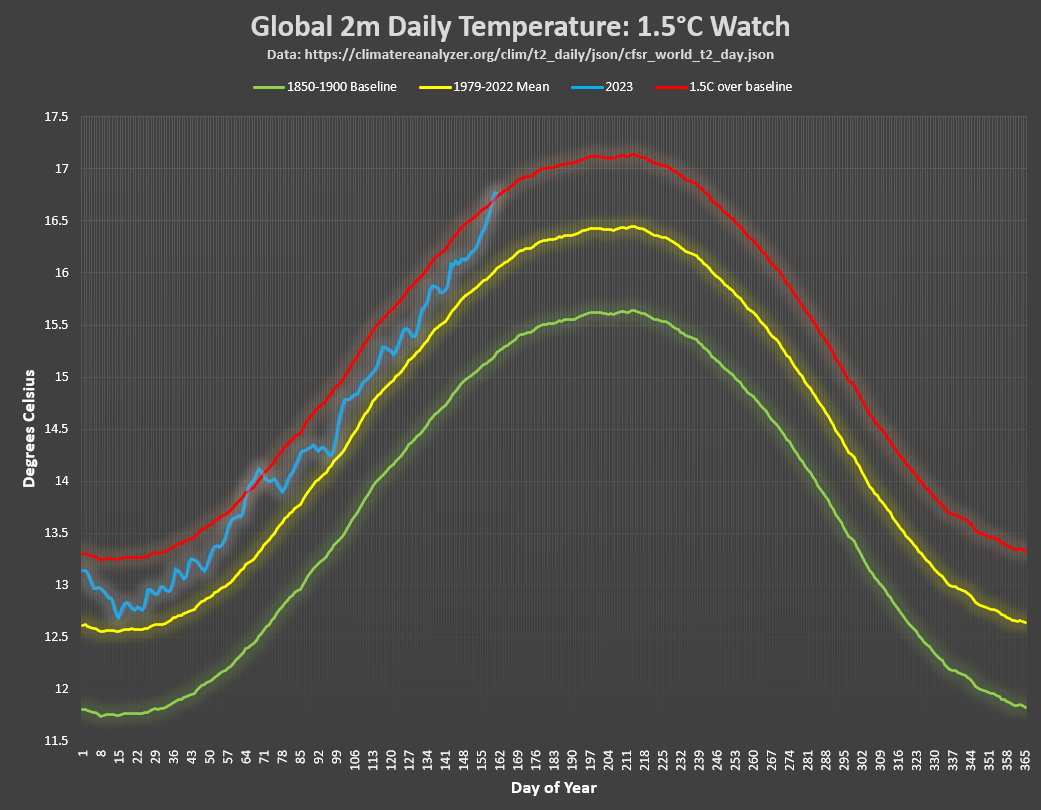
For the second WTF we are going to move from the ocean to land and consider global 2-meter surface temperatures, where on June 10, for the third consecutive day temperatures breached the 1.5°C barrier (above the 1850-1900 IPCC baseline). This is not the same as breaking the Paris 1.5°C barrier, which requires the long-term planetary average to be above 1.5°C. Nor is it the same as breaching 1.5°C for the year. These temperature spikes have happened many times before. But this breach does act as a benchmark for the inevitable future that’s coming. For those who like statistics, on June 9, global 2m temperatures reached 4.8 standard deviations above the 1979-2000 mean.
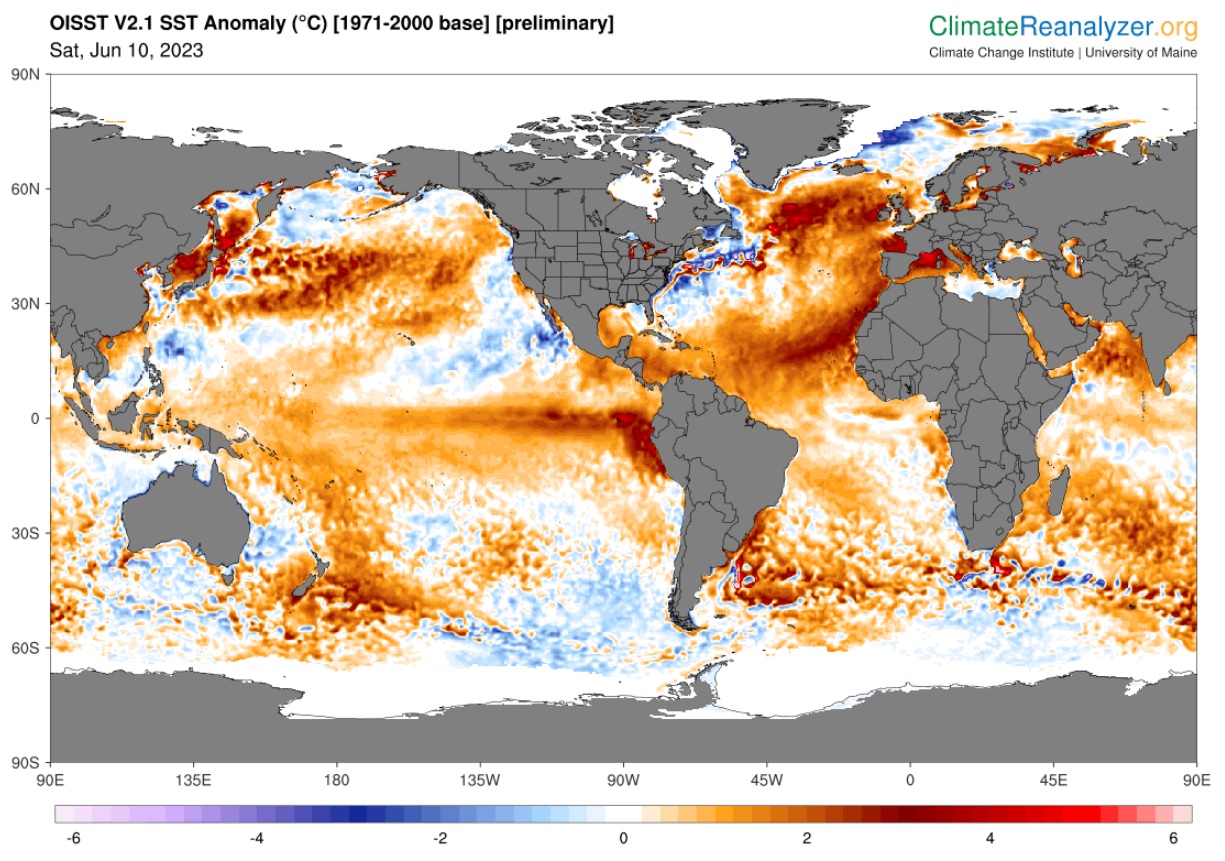
And the third WTF is perhaps the furthest from any notion of normalcy. WTF is happening to the world’s oceans, and in particular the North Atlantic? Ocean temperatures have been setting unprecedented daily records, spiking to highs that are shocking climate scientists, as they look for possible reasons.
Here is a picture from ClimateReanalyzer.com that gives a sense of world sea surface temperature anomalies on June 10:
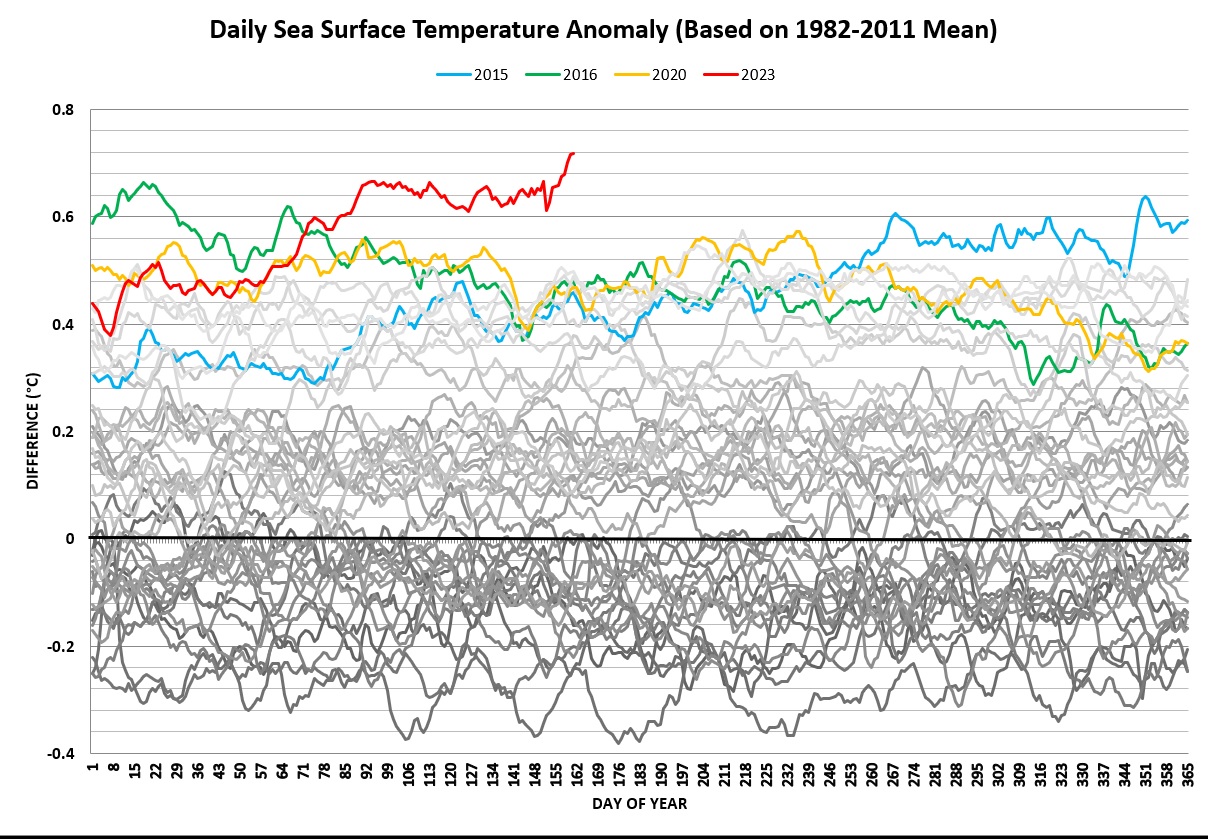
The following shows daily global sea-surface temperature (SST) anomalies over the region 60S-60N., for the years 1982-2022 in their entirety and through June 10 for the year 2023 (using this data).
The recent spike is hard to ignore. This should be the story by itself, and indeed international media has been giving it some attention. But there is a more localized story of ocean heating that I want to focus on.
And here is the true WTF image — the North Atlantic SST anomaly (using this data):
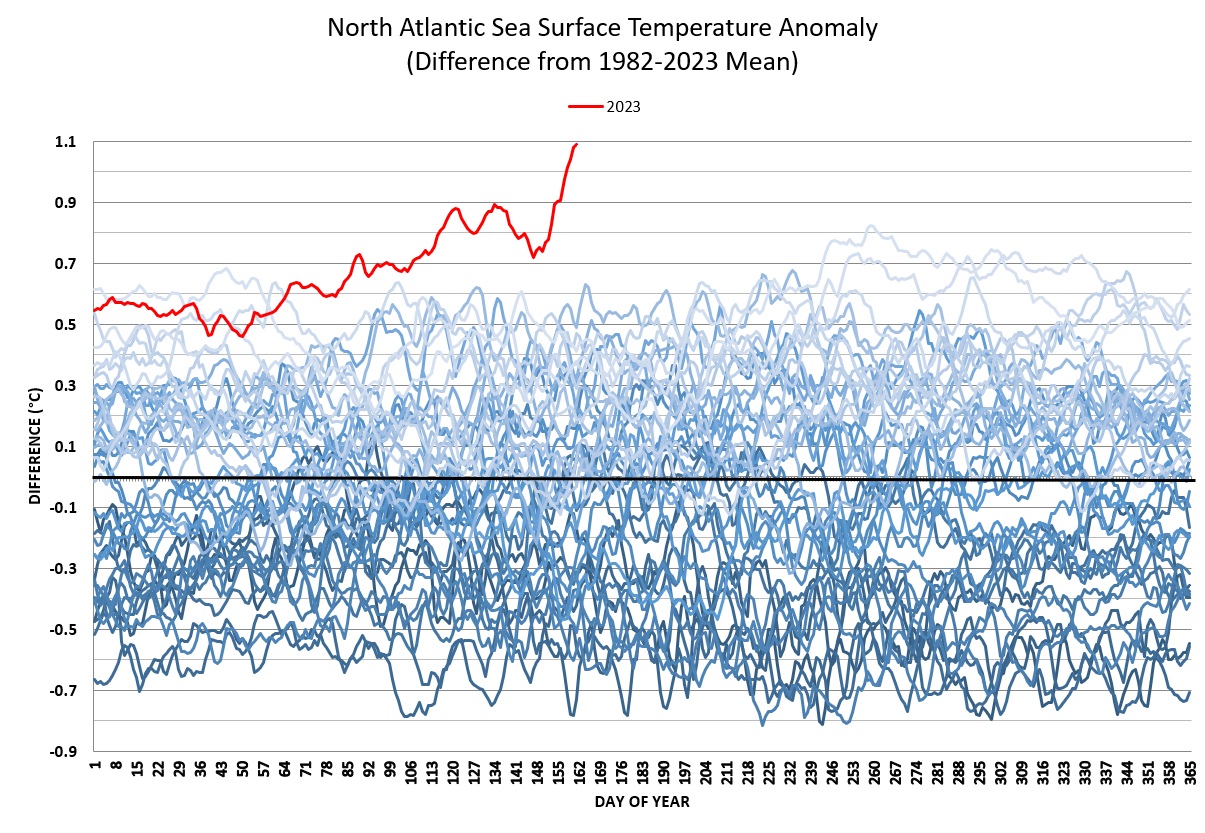
Since I first published the North Atlantic image on Twitter, this image has gone viral internationally. As of this writing, it has attracted over 2.7 million views on Twitter and has been featured in media worldwide. That’s how hungry people are to know what’s happening. The current North Atlantic anomaly is why I am writing this post and will be the subject of everything that follows.
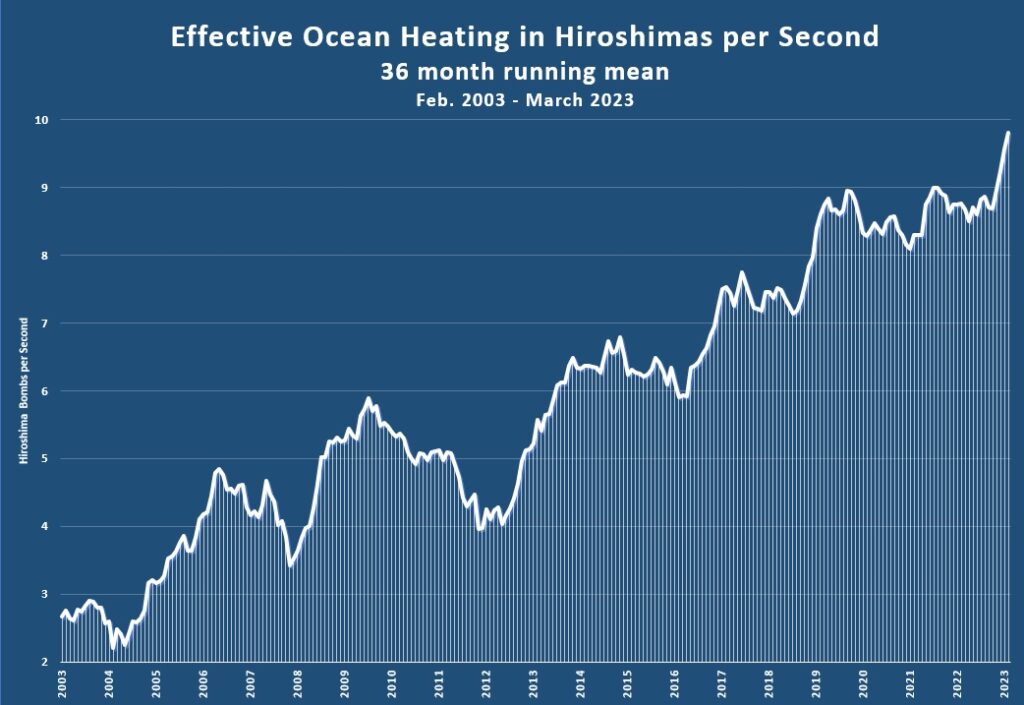
The CERES website publishes monthly updates to what is commonly known as the Earth Energy Imbalance or EEI. This data allows us to know the difference between incoming solar radiation and outgoing radiation from all sources. That difference is the effective rate of heating of the planet. As of March, 2023, on an annualized basis, the EEI was 1.61 Watts per square meter. That might not sound like a lot, but on a global basis it is about equal to the energy released from 13 Hiroshima sized nuclear bombs exploding every second.
As you probably know, the planet’s oceans absorb about 89% of the excess heat generated by global warming. Over the last three La Niña years on average, the ocean’s share of the EEI has been equivalent to about 9.8 Hiroshima bombs per second, or about 930 million Hiroshimas in total. The ocean is hot and getting hotter all the time, the total heat content of the ocean is at record highs, but until now we haven’t directly seen that heat make its way to the surface.
There is an obvious reason to explain some of the ocean heating that is happening right now: the unexpectedly rapid onset of El Niño, which typically drives massive surface heating of the Eastern tropical pacific. But what about other parts of the ocean? What about the North Atlantic?
Here’s where things get esoteric. As of January 1, 2020, the International Maritime Organization (IMO) put a limit on the sulfur content in shipping fuels, reducing the global upper limit on sulfur content from 3.50% to 0.50%. This policy is referred to as IMO 2020. Here is a link to an article describing this change. This reduced limit was mandatory and led to over a 75% drop in the emission of sulfur oxides. While great for the environment in many respects (e.g. less acid rain and ocean acidification), there was also a not-so-unexpected consequence.
Sulfate aerosols, in combination with atmospheric particulates, increase the amount of incoming sunlight reflected away from the Earth, effectively dimming the planet’s surface. Lasting only weeks to months in the atmosphere, these sulfate aerosols must be continually replenished to have their cooling impact. The IPCC suggests that current sulfur aerosol levels are contributing in the neighborhood of 0.5° C to total global cooling, offsetting warming that would otherwise rapidly occur. This is commonly known as “global dimming.”
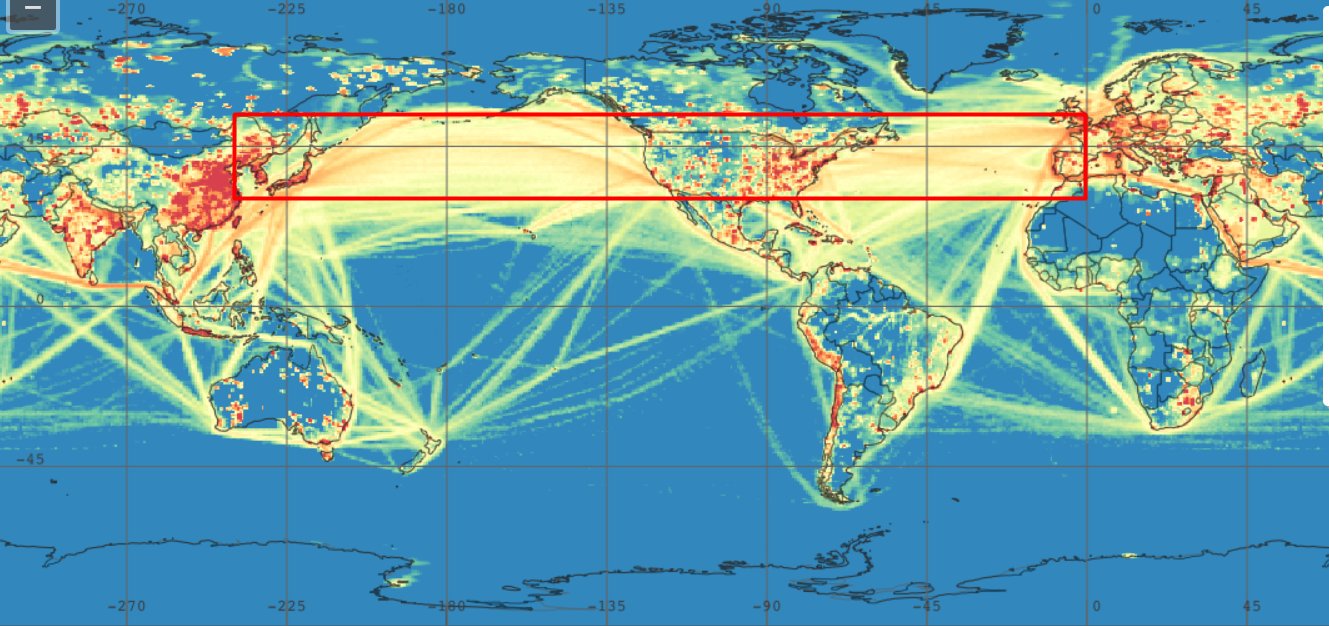
By cleaning up shipping fuels, massive regions of the world’s oceans that were protected from heating by shipping sulfate aerosols are now experiencing rapid warming. This includes the main shipping routes between Asia and the Western US as well as the major routes from the Eastern US to Europe and the Middle East. And that’s where the warming is happening. This rapid heating is known as “termination shock,” and it appears to be, at least in part, what’s happening right now.
This image, shared by Leon Simons on Twitter, highlights the regions of the oceans most impacted by this sudden change in sulfur content:
There is another possible input to this heating worthy of note. Dust from the Sahara typically blows west this time of year, blocking incoming radiation while trapping existing heat. So far this year, the dust has not come. The lack of dust is notable and could also be a direct cause of some of the North Atlantic heating. For more, here is an article on the topic.
And don’t forget about the Hunga Tonga-Hunga Ha’apai explosive underwater volcanic eruption on January 15, 2022 that sent massive plumes of water vapor into the stratosphere. While I don’t know of any direct connection of this event to recent ocean warming, the linked article shows there is wide-spread consensus that this event could accelerate global warming over the next few years. However, it is not at all clear how generalized global warming of the atmosphere from stratospheric water vapor could cause a relatively sudden spike in ocean temperatures.
It is my opinion that the combination of years of ocean heating generated by the Earth energy imbalance, heating in Antarctica due to open ocean, shifts in winds and surface heating due to El Niño, lack of Saharan dust, and IMO 2020 have together triggered unprecedented ocean surface warming. I don’t have the expertise to put these in any particular causal order, but that doesn’t really matter. The consequences are clear.
As we enter Northern hemisphere summer, large regions of the planet will experience all-time record heatwaves, fires, storms and flooding. These events will set records in intensity, duration and frequency. The planet’s overall temperature will spike to new highs for the modern era, with 1.5°C in sight for 2024. Antarctic polar sea-ice will continue its retreat from “normal”, exposing more open ocean to incoming solar radiation and heating, especially as the sun returns later this year. Crops will fail. Infrastructure will break beyond repair. Climate migration will spike. Meanwhile, carbon dioxide from anthropogenic sources continues to spew at a near-record rate, while the Paris limit of 1.5°C requires these emissions be reduced about 7% per year for the next decade.
And this is all happening in the midst of the current political and social chaos, while the world attempts to recover from a pandemic that is still ongoing but mostly ignored by global media.
These next two years are a preamble to what it will mean for the world to pass the Paris 1.5°C barrier. The end of global industrial civilization is where we are headed right now, not at some future dystopian moment. I wish I had a hopeful word to end with. But I don’t.
The most serious (WTF) global wake-up call so far.
I predict that the Press/Media/Govts will largely ignore it.
Amazing how clearly the El Ninos show up in the Oceans Heating graph at 3.33yr intervals.
Hi Eliot
Very grim news…
Thank you for all of your tireless work!
Looks like you recent posts really got some traction!
Thx Bill
They are not ignoring it, they have seen it on the charts, paid themselves unusually large remuneration packages and armed the warmongers, in case we get any funny ideas about sharing any of their wisely built bomb shelters and stores and seed banks.
Not one of these trends is a surprise for hundreds of years we have worshiped King oil and accepted the bribes for one more pipeline or one more oil field. They have held back disruptive technologies like hydrogen fuel cells and hydrogen engines and hydrogen as a lighter than air lifting substance. Any creative human thought was attacked to defend jobs and our greedy selfish culture. Its so bloody obvious and yet each politician honours the contracts and makes new ones as the lobby money is just too good to make any hasty decisions. Each politician kicking what they understand to be explosive tragedy into the next generation.
Earth humanity, too stupid to learn how to live – what an epitaph..
Thank you for paying attention – I have been pointing out the large number of criminals running things and this idiotic belief in the bible pushing folk to act irresponsibly. These climate issues are serious enough without leaps of fantasy. New leaders with the freedom to take reasonable corrective action – we can actually make ice and while there is a question of scale, I think we built the pyramids as they are there and being organised and focused on reality is such a simple lesson. I expect we can pay a few million folk to grow food on marginal land each seed produces such abundance. I actually wonder at how stupid our leaders have became. They ignore things for money, it is called turning a blind eye.
Eliot,
Do you have any discussion/data on the collapse of the North Atlantic current? Especially with regard to the effects on European climate.
Not at this time, sorry.
As you say, it’s all a bit more complicated than year to year events, and the interaction between ocean surface heating and natural long-term cycles in deep ocean upwelling are probably also a factor for the North Atlantic and elsewhere, but the EEI data don’t lie, despite the details. Is it really important whether the lemmings running over the cliff die of impact, drowning, or fright?
On your chart one of the regions of the oceans most impacted by this sudden change in sulfur content is the west coast of the USA (where I live). This area of the ocean is unusually cold this year but by this chart it should have warmed. Do you have any idea what some of the factors could be? I understand these are highly complex phenomena.
Yes, very complex, and beyond what I can comment on. The huge cold blob that has been off our coast for pretty much all of this year is still impacting us in very unusual ways.
Very interesting, the big question is what consequences we will see now regarding weather/nature and how fast they will unfold. Any thoughts? dX/dt and d2X/d2t
I like to measure the time between now and the collapse of industry in units of Playstation Releases.
Doubt we’ll hit 10.
How about iPhone #s? We’re at 14 now. Will we make it to 20?
Excellent article, I like the connection to sulfer redux as well as the sahara dust clouds. I suspect there may be others contributing, hopefully we can crowdsource the culprits and at least gather a more wholistic picture.
Truly, an excellent (well written, data packed, great analogies, etc) post, Eliot!
Bravo, my friend!!
Another awesome piece of work from Prof Jacobsen, one of the “go to” ocean warming authors on twitter. Someone whose academic interest is gambling is probably the best places to comment on current global policy on climate.
For some reason he’s blocked me on twitter, but this blog is a brilliant source of (terrifying) information.
Sorry about the block. I often block more than 100 accounts in a single sitting on Twitter, sometimes based on very loose criteria. That’s what it’s like when you’re overwhelmed by bots and paid disinformation campaigns.
Just send me an email with your Twitter handle & I’ll unblock.
Thanks for your kind comment.
As a fellow doomer, I will acknowledge that this post is absolutely brilliant and truthful, but since I live in the US, I know that Michael Mann will blame me personally for making all these anomalies happen.
Yes, I make all the supertankers run. I, alone, have stopped countless corporate self-imposed green “initiatives.” I’m also the man behind the Russian invasion of Ukraine. I, personally, see to it that all fraudulent voluntary aspirations from the COPs die on the corporate vine.
I’m the Inactivist, you see, and if I’m somehow erased from the global picture, then the Industrial world will be completely cleansed and made wonderfully pure for him and his children, with global profits galore for his sainted corporations.
Hi Elliot. Thanks for your work.
Hi Eliot,
Several weeks back, on one of your youtube livestreams, I asked you a general question about the aerosol masking effect. You replied, stating (paraphrasing), that the aerosol masking effect was more or less overstated with only a .5 degree celsius localized temperature increase if atmospheric aerosols were reduced. Does your post here contradict what you said earlier? I’m asking for clarification…thank you!
Respectfully,
Douglas Woods
Hi Douglas,
The IPCC puts the error bar globally for aerosol masking at 0.2C to 0.8C (more or less), with a center point at 0.5C. I don’t see that I have contradicted this in any way. Global impacts and localized impacts can differ, just like the Arctic heating at 4x the rate of the rest of the world does not contradict global warming predictions for 1.5C.
Just to clarify further,
…what I’m asking is…Does your interpretation of the data suggest the global dimming effect is stronger and less localized than thought previously given the latest SST increase?
I am not an expert in this area, but if you look closely at global ocean temperature anomalies, you will see that some of the strongest follow global shipping pathways. As far as being “strong than previously given,” there is no evidence I have seen to support that.
Okay. Thats good to know. Thanks for the response.
Outstanding article on a horrific subject.
We live in Western New York and last week the top news was smoke from Canadian wildfires. The weather pattern changed a few days later and it’s as if nothing ever happened. Until we are subjected to the climate equivalent of getting continually hit between the eyes by a 2×4, it’s hard to envision our predicament getting serious attention. At this point, I think I’d just like to see us reduce the rate at which we’re making things worse.
Another awesome piece of work from Prof Jacobsen, one of the “go to” ocean warming authors on twitter. Someone whose academic interest is gambling is probably the best places to comment on current global policy on climate.
For some reason he’s blocked me on twitter, but this blog is a brilliant source of (terrifying) information.
Great post. Thanks for the reminder of how bad things were, I was getting distracted…
Pucusana Peru here. Small fishing port-harbor town. Right in the middle of that big reddish brown stain on your color chart. Can’t say as the ocean feels noticeably warmer but the bird and marine life die-off from the H5N1 avian influenza continues un-abated. Local fishing activity out of the port ground to a halt for lack of catch about a month ago and continues idle. Normally by May the over-cast grey skies close in and it’s pretty much sunless for the next 4 to 5 months but we’re still getting sunny spring-like days 3 or 4 days a week – not that I’m complaining about that. Signing out, Willis
Scary stuff!! Thanks for keeping us posted! keep up the good work
I don’t understand why people are not only disinterested but not screaming for positive change. Every one can go vegan & stop flying for leisure. I run two small charities (since 1985): [links removed]. We’ve been shouting about biodiversity loss & then climate change for as long as I remember…& yet we are now in this tragic situation, with what future for our children.