April 8 quote by Naomi Klein does it for me. .. bit by bit, hour by hour, day by day,…
Methane 2018-to-Present = Yikes!
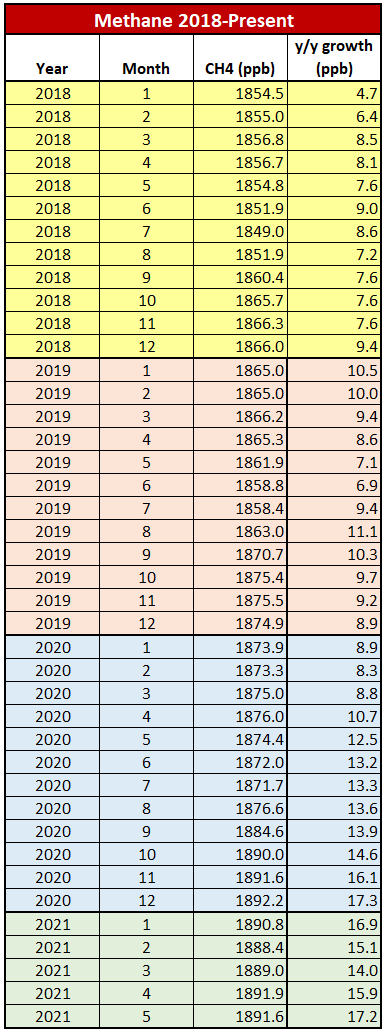
 For those who like data rather than graphics, in this post I’ve listed the global methane figures from January, 2018 to May, 2021. Along with the raw numbers, I’ve also given the year over year change.
What is clear is that over the last three years, the amount of CH4 entering the atmosphere has been accelerating. Most mitigation models plan on using methane control to give humanity enough time to solve the much more challenging and long-term issues we are having with CO2. Unfortunately, methane isn’t cooperating with this plan.
Full data here: https://gml.noaa.gov/ccgg/trends_ch4/
May, 2019 saw a year-over-year rise of 7.1 ppb from the level the same month in 2018. The amount jumped from 1854.8 ppb in May, 2018 to 1861.9 in May, 2019.
May, 2020 saw a rise of 12.5 ppb from the level in May, 2019, rising to 1874.4 ppb.
May, 2021 saw the biggest spike yet, a whopping 17.2 ppb leap up to 1891.6 ppb.
That means that in the last three years we have seen a growth in the yearly jump from 7.1 ppb in 2019 to 12.5 ppb in 2020 to 17.2 ppb in 2021.
Yikes!
There is a cyclical nature to atmospheric methance concentrations. Typically, May is one of the low months for global methane each calendar year. In 2018, the data shows a 11.5 ppb rise from the May, 2018 value to the peak value of 1866.3 in November 2018.
In 2019, the data shows a 13.6 ppb rise from the May, 2019 value to the peak value of 1875.5 in November, 2019.
In 2020, the data shows a 17.8 ppb rise from the May, 2020 value to the peak value of 1892.2 in December, 2020.
Projecting forward in 2021, we should expect to break through 1900 when the September, 2021 data is released (in January, 2022). And in 2021 we will reach a maximum in global CH4 somewhere between 1905 ppb and 1910 ppb in either November or December of 2021.
Yikes!